当前位置: > CentOS > CentOS教程 >

CentOS上使用MRTG监测网络设备流量情况

时间:2014-05-04 22:20来源:linux.it.net.cn 作者:it
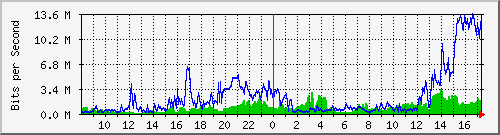
MRTG是一个开源的图形化的监控网络流量负载的工具(是德国OETIKER+PARTNER AG提供开源项目其中之一,http://oss.oetiker.ch/mrtg/ ),通过snmp协议得到设备的流量信息,并将流量负载以包含PNG格式的图形的HTML 文档以WEB方式显示给用户,以非常直观的形式显示流量负载(如下图)。

在CentOS5上使用MRTG监测网络设备流量情况 - leo.9@126 - Words of a Named Leo

   在X86架构的服务器上布置时,如果直接用系统里的YUM来安装是非常简单方便的一件事。而如果用SRC来完成,就得了解它所需要的支持如PERL、GD、LIBPNG、ZLIB了。


本文作者以自身实验来描述用YUM加载安装包完成的过程:

安装 MRTG


指令

yum -y install mrtg net-snmp*


由于我的网页发布是Apache的,所以如果没有该服务的需要加装它。


MRTG组件安装后会创建:

  一个简单的配置文件( /etc/mrtg/mrtg.cfg )、

  crontab档( /etc/cron.d/mrtg )、

  及Apache配置文件( /etc/httpd/conf.d/mrtg.conf )。


接下就是编辑 mrtg.cfg 文件。有两种方法:

一、只需删除注释,然后修改它们指向你要监视的设备。那需要你对MIB或OID信息有相当的了解,如果有可能以后补充。

二、也是我做的一种,相对简单。只需要使用cfgmaker,可以让 MRTG 自动创建一个mrtg.cfg(配置文件)。使用的方法如下:

使用cfgmaker


指令

cfgmaker public@192.168.0.1 > /etc/mrtg/mrtg.conf

public是IP为192.168.0.1这台设备SNMP的公共读出名;当然,你也可以将管道送往一个事先准备的其它文件,这样修改好后在CP过来。


自动生成的mrtg.conf文件中缺少Workpath,需要自己根据MRTG在APACHE的工作目录进行修改。


由于crontab档在安装时就已经是完整的,没有特殊要求就无需修改了。如果你和我一样着急看结果,就是本文最上面的那种流量监测图,可以在完成所有设置后进行一次

调试


指令

LANG=C LC_ALL=C /usr/bin/mrtg /etc/mrtg/mrtg.cfg --lock-file /var/lock/mrtg/mrtg_l --confcache-file /var/lib/mrtg/mrtg.ok


由于MRTG是通过APACHE发布的,之后需要根据实际情况修改APACHE用的配置文件( /etc/httpd/conf.d/mrtg.conf )。而MRTG在Apache的设置里只缺省了localhost可以WEB方式查看URL。如果需要在另一台机器上访问(我这里是所有机器都可以访问)这个URL,需要修改MRTG的Apache配置文件并重新引导Apache。

修改MRTG的Apache设置


指令

vi /etc/httpd/conf.d/mrtg.conf


Alias /mrtg /var/www/mrtg

<Location /mrtg>

   Order deny,allow

#    Deny from all

#    Allow from 127.0.0.1

#    Allow from ::1

   Allow from all

#    Allow from .example.com

</Location>

重新引导Apache服务


指令

service httpd restart


在APACHE的默认WEB页工作目录( /var/www )下会有一个mrtg目录,其中index.html文件并不存在。可以用MRTG组件中的 Indexmaker 来创建它(Indexmaker指令帮助见http://mrtg.cs.pu.edu.tw/doc/indexmaker.en.html)。你可以将以下指令加到crontab内,或者在每次修改mrtg.cfg后执行它。

创建索引页


指令

indexmaker --output=/var/www/mrtg/index.html  /etc/mrtg/mrtg.cfg


现在一些都已完成,应该可以用浏览器打开 http://你的服务网址/mrtg 来查看图表。

需要注意的事:除MRTG外,OETIKER+PARTNER AG开源项目(Tobi Oetiker, 2011-09-13记录)还有RDtool、SmokePing、RemOcular、Extopus、SpreadButler、DbToRia、OP Tools和OP SEPP。
  • RDtool - The Round Robin Database Tool

    在CentOS5上使用MRTG监测网络设备流量情况 - leo.9@126 - Words of a Named Leo
    All you need for time series data storage and graphing. Write your own custom network or application monitoring script in minutes or use one of the many pre-made solutions based on RRDtool.


  • SmokePing - The Deluxe Latency Monitor
    Probe for network and application latency. Identify hot spots, see trends developing, send alarms for critical conditions.

  • RemOcular - Your Eyes in the Cloud
    remOcular provides a AJAX web interface to Unix command line tools like traceroute, top, mpstat, .

  • Extopus - The Monitoring Aggregator
    Extopus is an aggregating frontend to monitoring systems. Its plug-in architecture provides an easy route to integrating output from a wide array of monitoring systems into a single instance of Extopus.

  • SpreadButler - The Spreadsheet Publisher
    Spreadbutler is an Ajax-based system for live integration of spreadsheet data into webpages indepent of the technology used to create the webpages themselves.

  • DbToRia - Database to Rich Internet Application
    DbToRia provides a generic web interface to your database application without further coding.

  • OP Tools - System Administration Tools
    Tools we use to make or life as system administrators easier and our customers happier.

  • OP SEPP - Software Deployment System
    System to manage and deploy software packages on Un*x platforms. SEPP is able to take advantages of (de)central package storages, NFS, and auto-mounting and allows concurrent software versions.


(责任编辑:IT)
------分隔线----------------------------
栏目列表
推荐内容