Tpcc-MySQL测试并使用gnuplot生成图表
时间:2014-12-29 19:24 来源:linux.it.net.cn 作者:IT
TPC(Tracsaction Processing Performance Council) 事务处理性能协会是一个评价大型数据库系统软硬件性能的非盈利的组织,TPC-C是TPC协会制定的,用来测试典型的复杂OLTP系统的性能。Tpcc-mysql是percona基于tpcc衍生出来的产品,专用于mysql基准测试,其源码放在bazaar上,因此需要先安装bazaar客户端。
项目地址:
https://code.launchpad.net/~percona-dev/perconatools/tpcc-mysql
一 下载工具
首先,安装bzr 客户端
-
# yum -y install bzr
下载tpcc-mysql过程中遇到的问题
-
# bzr branch lp:~percona-dev/perconatools/tpcc-mysql
-
bzr: ERROR: Couldn't import bzrlib and dependencies.
-
Please check the directory containing bzrlib is on your PYTHONPATH.
-
-
Traceback (most recent call last):
-
File "/usr/bin/bzr", line 102, in <module>
-
import bzrlibpython
-
ImportError: No module named bzrlib
提示找不到 bzrlib 模块,因为调用Python,建议升级到2.6版本
解决方法:
-
# find / -name bzrlib -print
-
/usr/lib64/python2.4/site-packages/bzrlib
定义环境变量:
-
# export PYTHONPATH=/usr/lib64/python2.4/site-packages
再次下载ok.
-
#bzr branch lp:~percona-dev/perconatools/tpcc-mysql
-
You have not informed bzr of your Launchpad ID, and you must do this to
-
write to Launchpad or access private data. See "bzr help launchpad-login".
-
Branched 48 revision(s).
-
bzr: warning: some compiled extensions could not be loaded; see <https://answers.launchpad.net/bzr/+faq/703>
二 编译安装
进入源码目录
-
#cd tpcc-mysql/src
-
#make
-
cc -w -O2 -g -I. `mysql_config --include` -c load.c
-
cc -w -O2 -g -I. `mysql_config --include` -c support.c
-
cc load.o support.o `mysql_config --libs_r` -lrt -o ../tpcc_load
-
cc -w -O2 -g -I. `mysql_config --include` -c main.c
-
cc -w -O2 -g -I. `mysql_config --include` -c spt_proc.c
-
cc -w -O2 -g -I. `mysql_config --include` -c driver.c
-
cc -w -O2 -g -I. `mysql_config --include` -c sequence.c
-
cc -w -O2 -g -I. `mysql_config --include` -c rthist.c
-
cc -w -O2 -g -I. `mysql_config --include` -c neword.c
-
cc -w -O2 -g -I. `mysql_config --include` -c payment.c
-
cc -w -O2 -g -I. `mysql_config --include` -c ordstat.c
-
cc -w -O2 -g -I. `mysql_config --include` -c delivery.c
-
cc -w -O2 -g -I. `mysql_config --include` -c slev.c
-
cc main.o spt_proc.o driver.o support.o sequence.o rthist.o neword.o payment.o ordstat.o delivery.o slev.o `mysql_config --libs_r` -lrt -o ../tpcc_start
三 初始化测试库环境
make命令会在tpcc-mysql目录下生成 tpcc 命令行工具 tpcc_load ,tpcc_start
tpcc_load 提供初始化数据的功能
tpcc_start 进行压力测试
用法:
-
# ./tpcc_load --help
-
tpcc_load [server] [DB] [user] [pass] [warehouse]
-
Server: 服务器名
-
DB: 数据库名
-
user: 用户名
-
pass: 密码
-
Warehouse: 仓库的数量
-
#./tpcc_start --help
-
tpcc_start -h server_host -P port -d database_name -u mysql_user -p mysql_password -w warehouses -c connections -r warmup_time -l running_time -i report_interval -f report_file
-
介绍一下各个参数的用法
-
-h server_host: 服务器名
-
-P port : 端口号,默认为3306
-
-d database_name: 数据库名
-
-u mysql_user : 用户名
-
-p mysql_password : 密码
-
-w warehouses: 仓库的数量
-
-c connections : 线程数,默认为1
-
-r warmup_time : 热身时间,单位:s,默认为10s ,热身是为了将数据加载到内存。
-
-l running_time: 测试时间,单位:s,默认为20s
-
-i report_interval: 指定生成报告间隔时长
-
-f report_file: 测试结果输出文件
注意
tpcc 默认会读取/var/lib/mysql/mysql.sock 这个socket位置,如果你的测试环境的mysql socket不在相应路径的话,就需要做个软连接,或者通过TCP/IP的方式连接测试服务器。
准备工作:
-
#mysql -uroot -p -e "create database tpcc" # 创建测试用的数据库
-
#mysql -uroot -p tpcc < create_table.sql # 创建测试用的表
-
#mysql -uroot -p tpcc < add_fkey_idx.sql # 创建FK和索引
1 创建五个数据仓库
-
#./tpcc_load localhost tpcc root "123456" 5
-
*************************************
-
*** ###easy### TPC-C Data Loader ***
-
*************************************
-
<Parameters>
-
[server]: localhost
-
[port]: 3306
-
[DBname]: tpcc
-
[user]: root
-
[pass]: 123456
-
[warehouse]: 5
-
TPCC Data Load Started...
-
Loading Item
-
.................................................. 5000
-
.................................................. 10000
-
忽略部分输出结果
四、进行测试
使用tpcc_start 进行5个线程的测试,热身时间为120秒, 测试时间为1小时 !
-
# ./tpcc_start -hlocalhost -d tpcc -u root -p "123456" -w 5 -c 5 -r 120 -l 300 - >tpcc-output-log
五、生成图表
首先写一个脚本获取数据源:
-
# cat tpcc-output-analyze.sh
-
#!/bin/sh
-
-
TIMESLOT=1
-
if [ -n "$2" ]
-
then
-
TIMESLOT=$2
-
fi
-
cat $1 | grep -v HY000 | grep -v payment | grep -v neword | awk -v timeslot=$TIMESLOT 'BEGIN { FS="[,():]"; s=0; cntr=0; aggr=0 } /MEASURING START/ { s=1} /STOPPING THREADS/ {s=0} /0/ { if (s==1) { cntr++; aggr+=$2; } if ( cntr==timeslot ) { printf ("%d %3d\n",$1,(aggr/timeslot)) ; cntr=0; aggr=0 } }'
-
# cat tpcc-output-analyze.sh
-
#!/bin/sh
-
-
TIMESLOT=1
-
if [ -n "$2" ]
-
then
-
TIMESLOT=$2
-
fi
-
cat $1 | grep -v HY000 | grep -v payment | grep -v neword | awk -v timeslot=$TIMESLOT 'BEGIN { FS="[,():]"; s=0; cntr=0; aggr=0 } /MEASURING START/ { s=1} /STOPPING THREADS/ {s=0} /0/ { if (s==1) { cntr++; aggr+=$2; } if ( cntr==timeslot ) { printf ("%d %3d\n",$1,(aggr/timeslot)) ; cntr=0; aggr=0 } }'
这个脚本就是对 tpcc-output-nobinlog 的第一列与第二列进行运算。
-
#./tpcc-output-analyze.sh tpcc-output-nobinlog > tpcc-graphic-data.txt
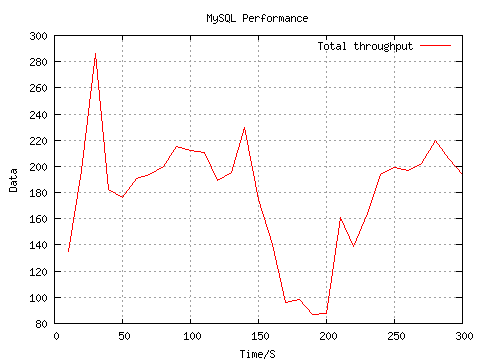
绘图过程:
-
#cat log.conf
-
set terminal gif small size 480,360 #指定输出成gif图片,且图片大小为550×25
-
set output "tcpp.gif" #指定输出gif图片的文件名
-
set title "MySQL Performance" #图片标题
-
set style data lines #显示网格
-
set xlabel "Time/s" #X轴标题
-
set ylabel "Data" #Y轴标题
-
set grid #显示网格
-
plot \
-
"tpcc-graphic-data.txt" using 1:2 title "Total throughput" with lines #从tpcc-graphic-data.txt文件中读取第一列和第二列作为X轴和Y轴数据,示例名"Total throughput"
-
#cat log.conf
-
set terminal gif small size 480,360 #指定输出成gif图片,且图片大小为550×25
-
set output "tcpp.gif" #指定输出gif图片的文件名
-
set title "MySQL Performance" #图片标题
-
set style data lines #显示网格
-
set xlabel "Time/s" #X轴标题
-
set ylabel "Data" #Y轴标题
-
set grid #显示网格
-
plot \
-
"tpcc-graphic-data.txt" using 1:2 title "Total throughput" with lines #从tpcc-graphic-data.txt文件中读取第一列和第二列作为X轴和Y轴数据,示例名"Total throughput"
运行生成tcpp.gif:
-
#cat log.conf | gnuplot
示例:

补充gnuplot绘图,详细可以google下
例如得到文件类似如下:
-
11:23 28 15
-
11:24 10 7
-
11:25 224 37 13
-
11:26 470 192
-
11:27 344 187 1
-
11:28 441 77 2
-
11:29 419 8
然后创建gnuplot.conf如下:
-
set terminal png xFFEEDD size 2048,512
-
set output "log.png"
-
set autoscale
-
set xdata time
-
set timefmt "%H:%M"
-
set format x "%H:%M"
-
set xtics 10
-
set mxtics 4
-
set style data lines
-
set datafile missing "0″
-
set xlabel "time per day"
-
set ylabel "purge"
-
set title "DPD expires"
-
set grid
-
plot "log" using 1:2 title "html/min","log" using 1:3 title "js/min","log" using 1:4 title "css/min"
运行cat gnuplot.conf|gnuplot就得到log.png了,如下:

参考文章:
http://raocl.wordpress.com/2010/11/25/inotify-purge%E5%90%8E%E7%BB%AD%E5%88%86%E6%9E%90/
http://www.tuicool.com/articles/zMRF7r
(责任编辑:IT)
TPC(Tracsaction Processing Performance Council) 事务处理性能协会是一个评价大型数据库系统软硬件性能的非盈利的组织,TPC-C是TPC协会制定的,用来测试典型的复杂OLTP系统的性能。Tpcc-mysql是percona基于tpcc衍生出来的产品,专用于mysql基准测试,其源码放在bazaar上,因此需要先安装bazaar客户端。
项目地址: https://code.launchpad.net/~percona-dev/perconatools/tpcc-mysql
一 下载工具 首先,安装bzr 客户端
下载tpcc-mysql过程中遇到的问题
提示找不到 bzrlib 模块,因为调用Python,建议升级到2.6版本 解决方法:
定义环境变量:
再次下载ok.
二 编译安装 进入源码目录
三 初始化测试库环境 make命令会在tpcc-mysql目录下生成 tpcc 命令行工具 tpcc_load ,tpcc_start tpcc_load 提供初始化数据的功能 tpcc_start 进行压力测试 用法:
注意 tpcc 默认会读取/var/lib/mysql/mysql.sock 这个socket位置,如果你的测试环境的mysql socket不在相应路径的话,就需要做个软连接,或者通过TCP/IP的方式连接测试服务器。 准备工作:
1 创建五个数据仓库
四、进行测试 使用tpcc_start 进行5个线程的测试,热身时间为120秒, 测试时间为1小时 !
五、生成图表 首先写一个脚本获取数据源:
这个脚本就是对 tpcc-output-nobinlog 的第一列与第二列进行运算。
绘图过程:
运行生成tcpp.gif:
示例:
补充gnuplot绘图,详细可以google下 例如得到文件类似如下:
然后创建gnuplot.conf如下:
运行cat gnuplot.conf|gnuplot就得到log.png了,如下:  参考文章: http://raocl.wordpress.com/2010/11/25/inotify-purge%E5%90%8E%E7%BB%AD%E5%88%86%E6%9E%90/ http://www.tuicool.com/articles/zMRF7r (责任编辑:IT) |