|
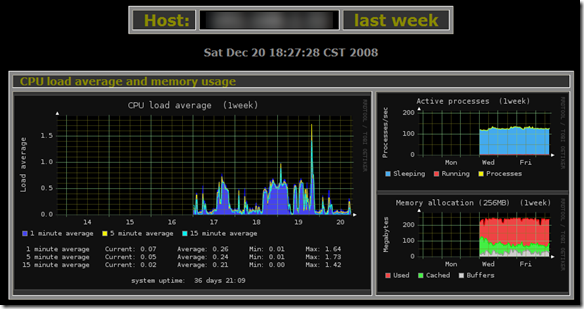
Monitorix 3.8.0 �������ð汾������4���µ�ͼ�κ�һЩ�����ԣ���ȻҲ������ bug ������ - Added a complete graph for the 'du' command. (suggested by Julien Flatrès, julien_flatres AT yahoo.fr) - Added a complete graph for the PageSpeed Module. (suggested by Jeroen Kik, monitorix AT steelyard.nl) - Added a complete graph for the 'upsc' (Network UPS Tools) command. [#95] - Added a complete graph for the ZFS filesystem. (suggested by Kilian Cavalotti, kilian AT stanford.edu and others) - Changed the code in Wowza Server graph to treat MessagesInBytesRate and MessagesOutBytesRate as gauge values. [#86] - Changed to a clickable link the bottom URL in the Apache graph, and fixed the text color. - Changed to a clickable link the bottom URL in the Lighttpd graph, and fixed the text color. - Changed to a clickable link the bottom URL in the PHP APC graph, and fixed the text color. - Added custom url config option 'logo_top_url' for the top logo link. [#90] - Added support for postfix-policyd-spf-perl SPF handler in Mail graph. (thanks to Claude Nadon, claude AT ws01.info) - Added support for process names that include spaces in Process graph. [#94] - Added the ability to include an alert for each defined filesystem in the 'fs' graph. The previous unique alert system in this graph is now deprecated. - Improved the Apache graph adding more statistical values and graphs. (suggested by Marco Reale, mlist AT libero.it) - Added Varnish 4 compatibility (partial). [#98] - Added support of Basic Authentication to Wowza graph. [#100] - Added alert capabilities to Apache graph based on the remaining free slots. (suggested by Marco Reale, mlist AT libero.it) - Added the new option 'ipv6_disabled' (default: no) to disable IPv6 monitoring. - Fixed the text color in the bottom URL of the Bind graph. - Fixed the text color in the bottom URL of the Icecast Streaming Server graph. - Fixed a problem with multiple 'ApplicationInstance' tags in Wowza Server graph. [#88] - Fixed the text color in the bottom URL of the Wowza graph. - Fixed to avoid results garbled when a defined Application is shutdown or if multiple servers are defined in the Wowza graph. [#89] - Fixed a pair of incorrectly defined values in the 'system' graph that affected the new RRDtool 1.5 branch with the message "Function update_pdp_prep, case DST_GAUGE - Cannot convert '' to float". [#91] - Fixed a parsing error when using process names with the character colon. (thanks to Harold Pena, haroldpena AT hotmail.com for pointing this out) - Fixed to put the output of the 'addendum_script' at the bottom of the email, and to avoid being repeated on each graph in the 'emailreports' graph. (thanks to Dirk Tanneberger, os AT tanneberger.biz) - Fixed a wrong example in the documentation when showing how to define the same port number using IPv4 and IPv6 in the 'port' graph. (thanks to Dirk Tanneberger, os AT tanneberger.biz for pointing this out) - Fixed to not show the red background color in listening network ports using IPv6 in the 'port' graph. (thanks to Dirk Tanneberger, os AT tanneberger.biz for pointing this out) - Fixed to avoid checking 'iptables' version on BSD systems. - Fixed to use 'swapctl' instead of 'swapinfo' in OpenBSD. - Fixed to show the correct uptime in additional Wowza servers. - Fixed to remove the authentication information from the URLs shown in the bottom of Wowza graphs. - Fixed a bug in the regexp of memory graph in OpenBSD. - Fixed to show hidden colors of some values in the Icecast graph. [#108] - Small cosmetic changes. ���������뿴��changelog ����ҳ�棺downloads Monitorix ���ߣ��@��һ���ԱO��ϵ�y��B�Ĺ��ߣ��ɱO�ص��Ŀ�dz��Ķ࣬��Ҳ���������O��Ҫ�O�صķ��գ��A�O�Ϳ��Է��� CPU �cӛ���wʹ���ʡ��ŵ���ȡʹ����(Disk I/O Usage)���W·ʹ����(Network traffic and usage)��������ʹ������(network services demand)��ʹ���ߵ���Ġ�r��....�ȵ� ��ͼ�Ǽ�ؽ����ͼ��
|

