|
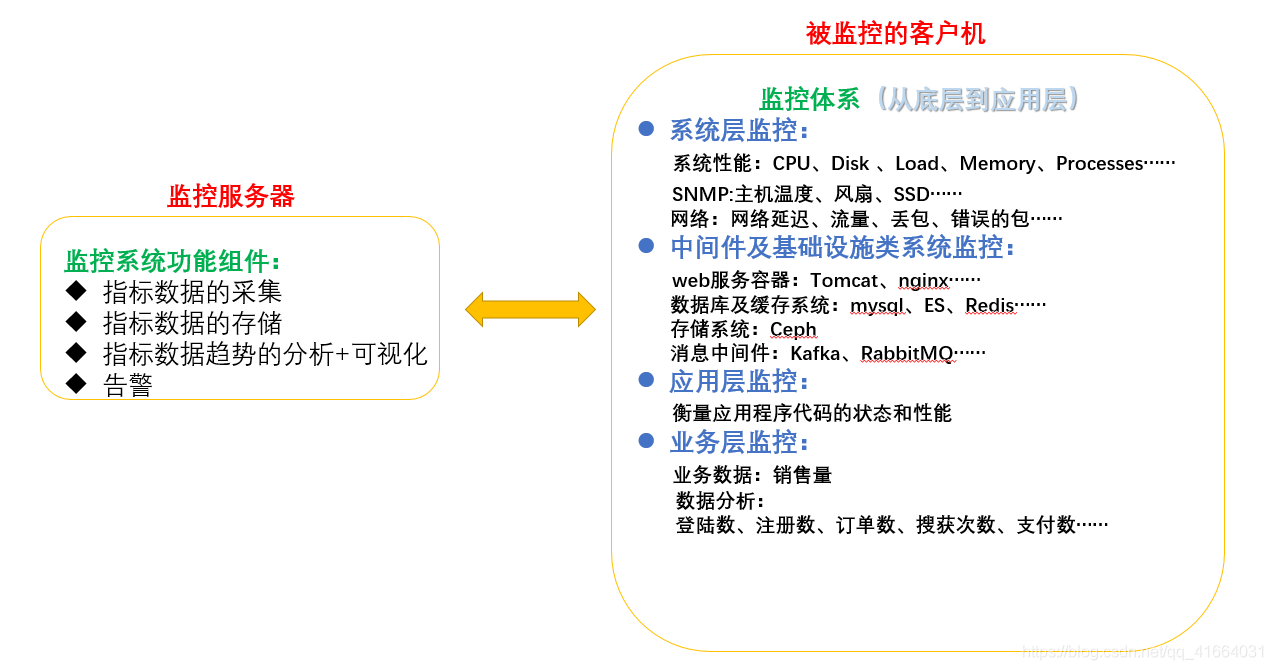
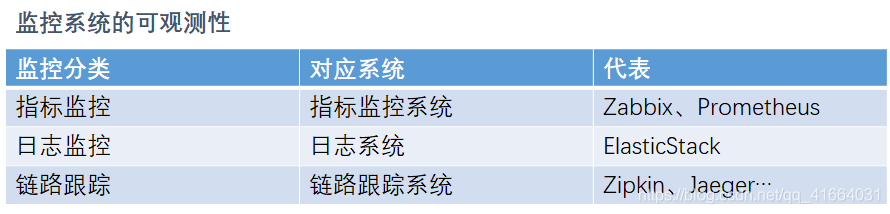
一、通用监控系统基础知识以及Prometheus的概述
二、工作原理及适用性
memory_free{ip="10.100.1.2"}        6238
     键       标签(作为过滤器)       值
4.指标类型
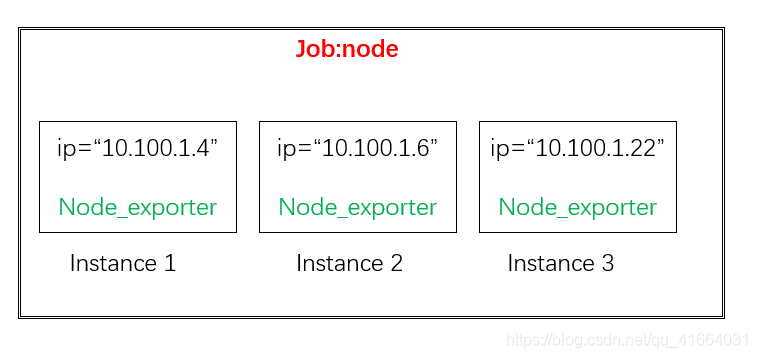
5.作业(Job)和实例(Instance) 实例instance:每个网络端点叫一个实例 作业Job:有相同功能的实例的集合称为一个Job. *
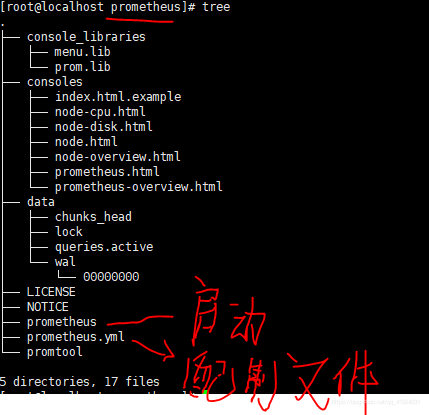
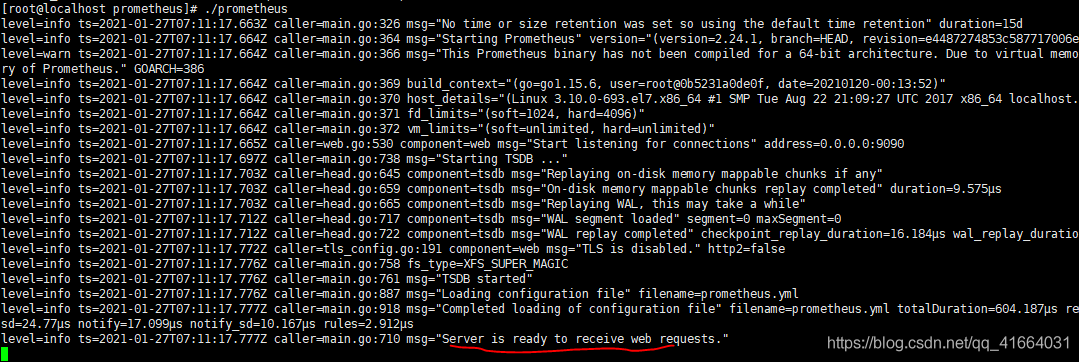
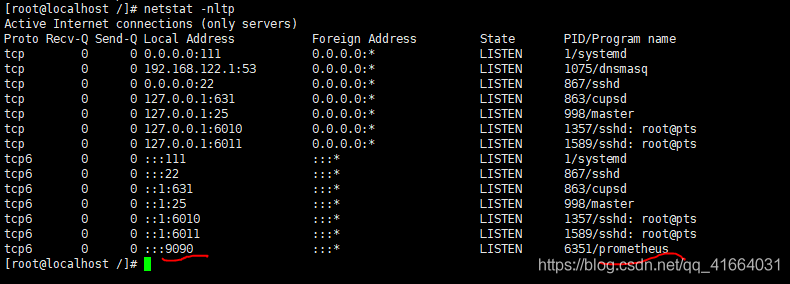
三、Prometheus-Server 部署 1.Prometheus-server的部署,二进制包安装 [root@localhost ~]# mkdir /prometheus && chown -R root:root /prometheus [root@localhost ~]# cd /prometheus [root@localhost prometheus]# tar -zxvf prometheus-2.24.1.linux-386.tar.gz [root@localhost prometheus]# cd prometheus-2.24.1.linux-386/ [root@localhost prometheus-2.24.1.linux-386]# cd .. [root@localhost prometheus]# ln -s prometheus-2.24.1.linux-386 prometheus [root@localhost prometheus]# ll total 62100 lrwxrwxrwx 1 root root 27 Jan 26 23:09 prometheu -> prometheus-2.24.1.linux-386 drwxr-xr-x 4 3434 3434 132 Jan 19 18:10 prometheus-2.24.1.linux-386 -rw-r--r-- 1 root root 63587661 Jan 22 04:23 prometheus-2.24.1.linux-386.tar.gz [root@localhost prometheus]# cd prometheus [root@localhost prometheus]# ll total 145780 drwxr-xr-x 2 3434 3434 38 Jan 19 18:08 console_libraries drwxr-xr-x 2 3434 3434 173 Jan 19 18:08 consoles -rw-r--r-- 1 3434 3434 11357 Jan 19 18:08 LICENSE -rw-r--r-- 1 3434 3434 3420 Jan 19 18:08 NOTICE -rwxr-xr-x 1 3434 3434 79203846 Jan 19 16:16 prometheus -rw-r--r-- 1 3434 3434 926 Jan 19 18:08 prometheus.yml -rwxr-xr-x 1 3434 3434 70051362 Jan 19 16:18 promtool [root@localhost prometheus]# ./prometheus
(5).为了方便,我们需要把prometheus运行在后台,需要把服务添加到系统服务内。
[root@localhost prometheus]# touch prometheus.log  &&chmod 755 prometheus.log
[root@localhost prometheus]# vim peometheus.sh
[root@localhost prometheus]# chmod 755 prometheus.sh
[root@localhost prometheus]# vim /usr/lib/systemd/system/prometheus.service
[root@localhost prometheus]# systemctl start prometheus.service
[root@localhost prometheus]# systemctl status prometheus.service
启动脚本prometheus.sh #!/bin/bash #引用的是二进制包内的原始的启动脚本和原始配置文件,所以文件的路劲要注意不要写错 /prometheus/prometheus/prometheus --config.file=/prometheus/prometheus/prometheus.yml &>> /prometheus/prometheus.log 添加到service内prometheus.service,注意文件路径/usr/lib/systemd/system/ [Unit] Description=Prometheus [Service] User=root Group=root Type=simple #使用我们自定义的启动脚本,否则如果用原始的启动脚本将无法保存日志 ExecStart=/prometheus/prometheus.sh [Install] WantedBy=multi-user.target
四、exporter的部署—>node_exporter为例,其他类型安装方式一致
【1】Node_exporter的部署
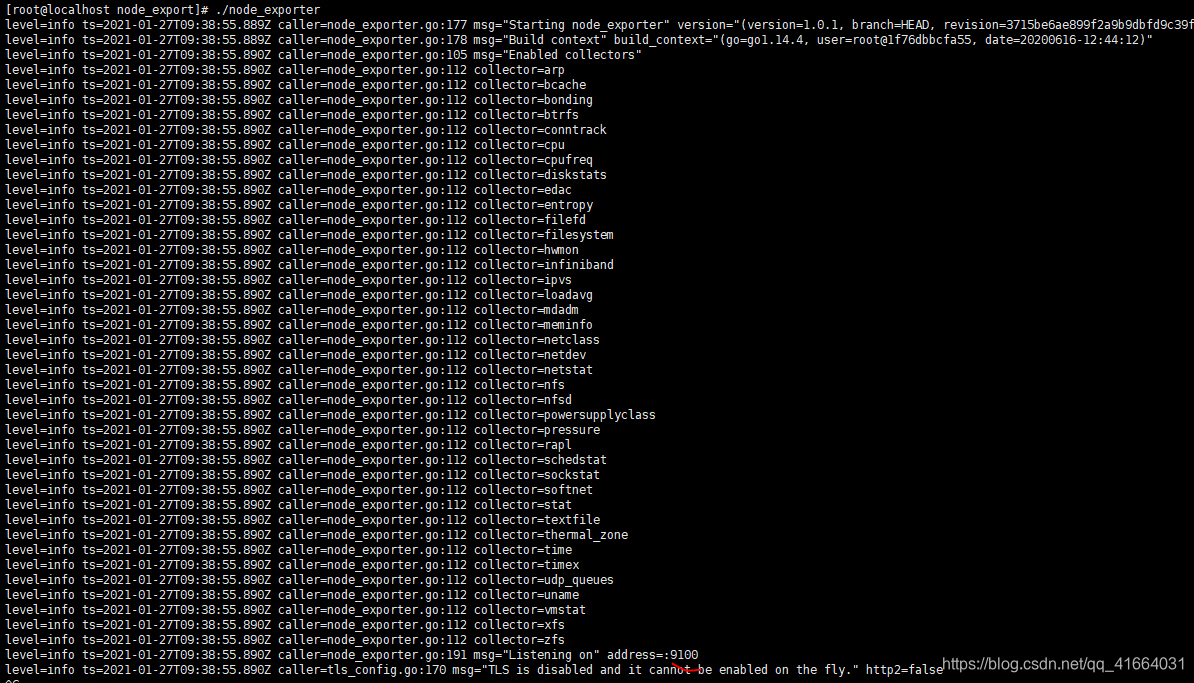
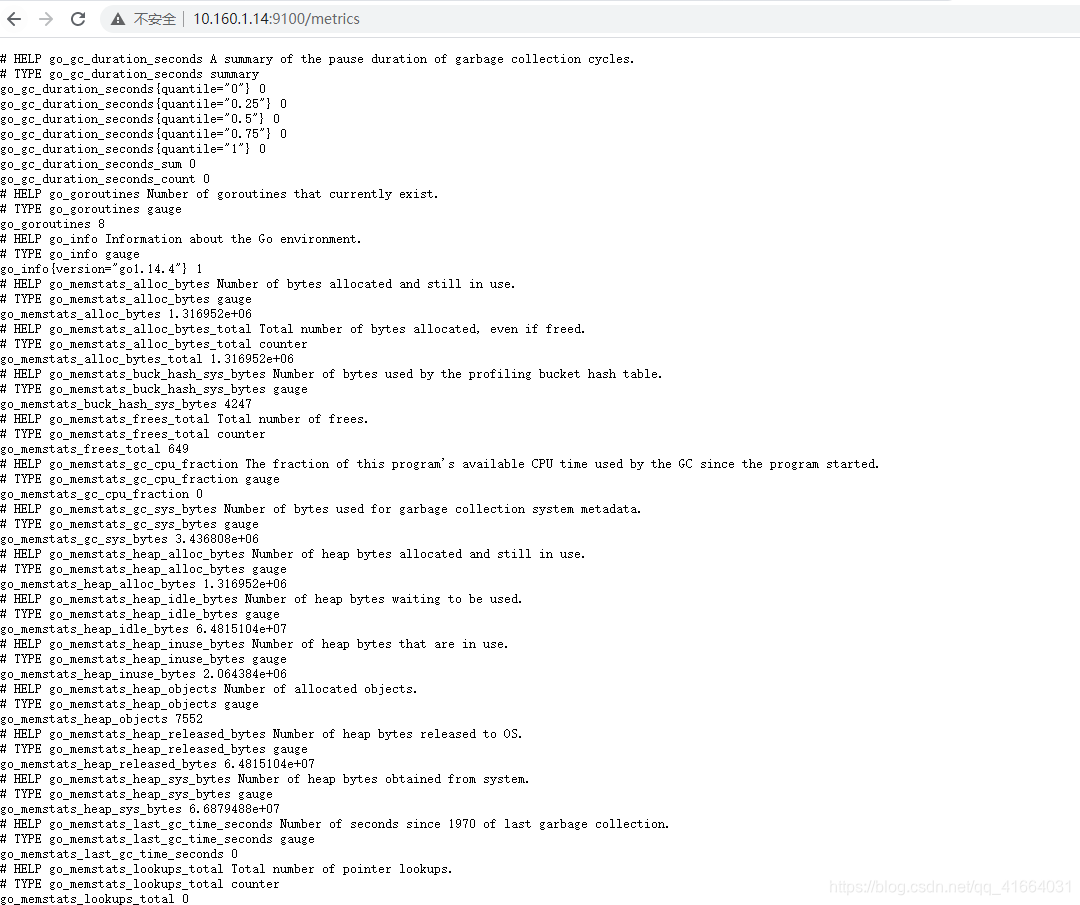
[root@localhost /]# mkdir /exporter && chown -R root:root /exporter/*
[root@localhost /]# cd /exporter/
[root@localhost exporter]# rz
[root@localhost exporter]# ll
[root@localhost exporter]# tar -zxvf node_exporter-1.0.1.linux-amd64.tar.gz
[root@localhost exporter]# ln -s node_exporter-1.0.1.linux-amd64 node_exporter
[root@localhost exporter]# cd node_export
[root@localhost node_export]# ./node_exporter
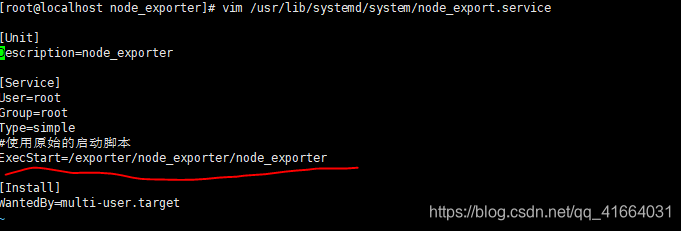
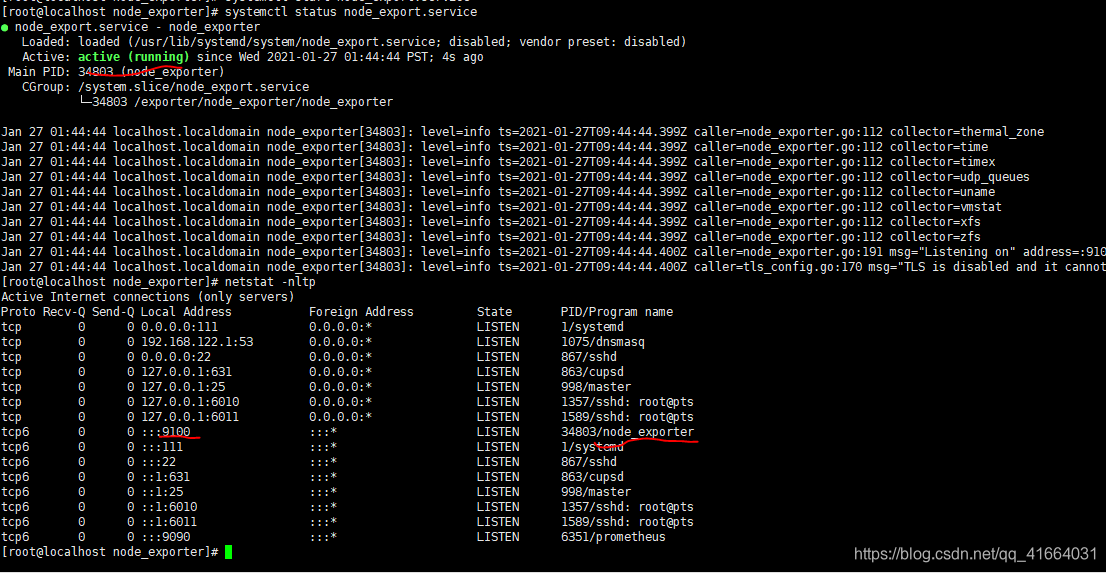
[root@localhost node_export]# vim /usr/lib/systemd/system/node_export.service
[root@localhost node_export]# systemctl daemon-reload
[root@localhost node_export]# systemctl start node_export.service
[root@localhost node_export]# systemctl enanle node_export.service
[root@localhost node_export]# systemctl status node_export.service
【2】监控Mysql、Tomcat、Nginx
[root@localhost ~]# mkdir /mysqld_exporter && chown -R root:root /mysqld_exporter
[root@localhost ~]# cd /mysqld_exporter/
[root@localhost mysqld_exporter]# rz
[root@localhost mysqld_exporter]# tar -zxvf mysqld_exporter-0.12.1.linux-386.tar.gz
[root@localhost mysqld_exporter]# ln -s mysqld_exporter-0.12.1.linux-386 mysqld_exporter
[root@localhost mysqld_exporter]# vim my.cnf
[client]
host=127.0.0.1
user=exporter
password=passwd1!
#与mysql权限配置一致,用户名 密码如下配置
[root@localhost mysqld_exporter]# mysql
grant all privileges on *.* to 'exporter'@'127.0.0.1' identified by 'passwd1!';
[root@localhost mysqld_exporter]# vim /usr/lib/systemd/system/mysqld_exporter.service
mysqld_exporter.service内容示例 root@localhost mysqld_exporter]# vim /usr/lib/systemd/system/mysqld_exporter.service [Unit] Description=mysqld_exporter After=network.target [Service] Type=simple User=root ExecStart=/mysqld_exporter/mysqld_exporter/mysqld_exporter --config.my-cnf=/mysqld_exporter/mysqld_exporter/my.cnf \ --collect.slave_status \ --collect.slave_hosts \ --log.level=error \ --collect.info_schema.processlist \ --collect.info_schema.innodb_metrics \ --collect.info_schema.innodb_tablespaces \ --collect.info_schema.innodb_cmp \ --collect.info_schema.innodb_cmpmem Restart=on-failure [Install] WantedBy=multi-user.targe
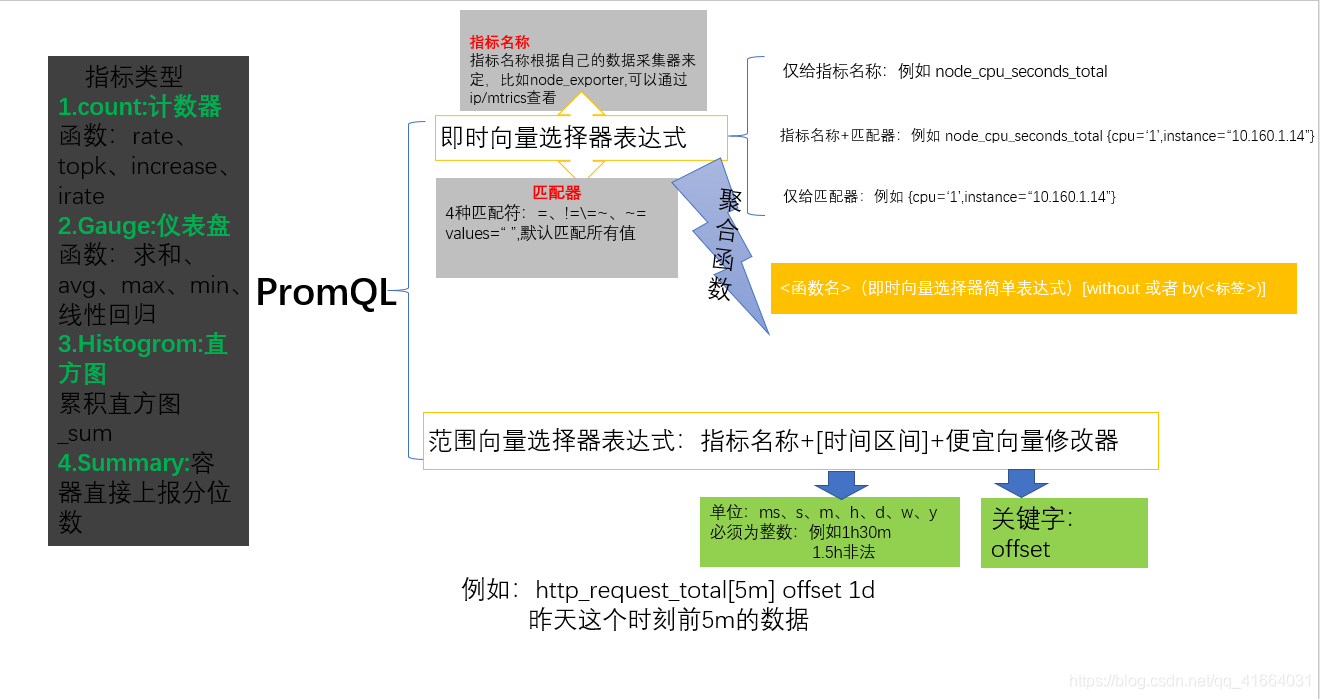
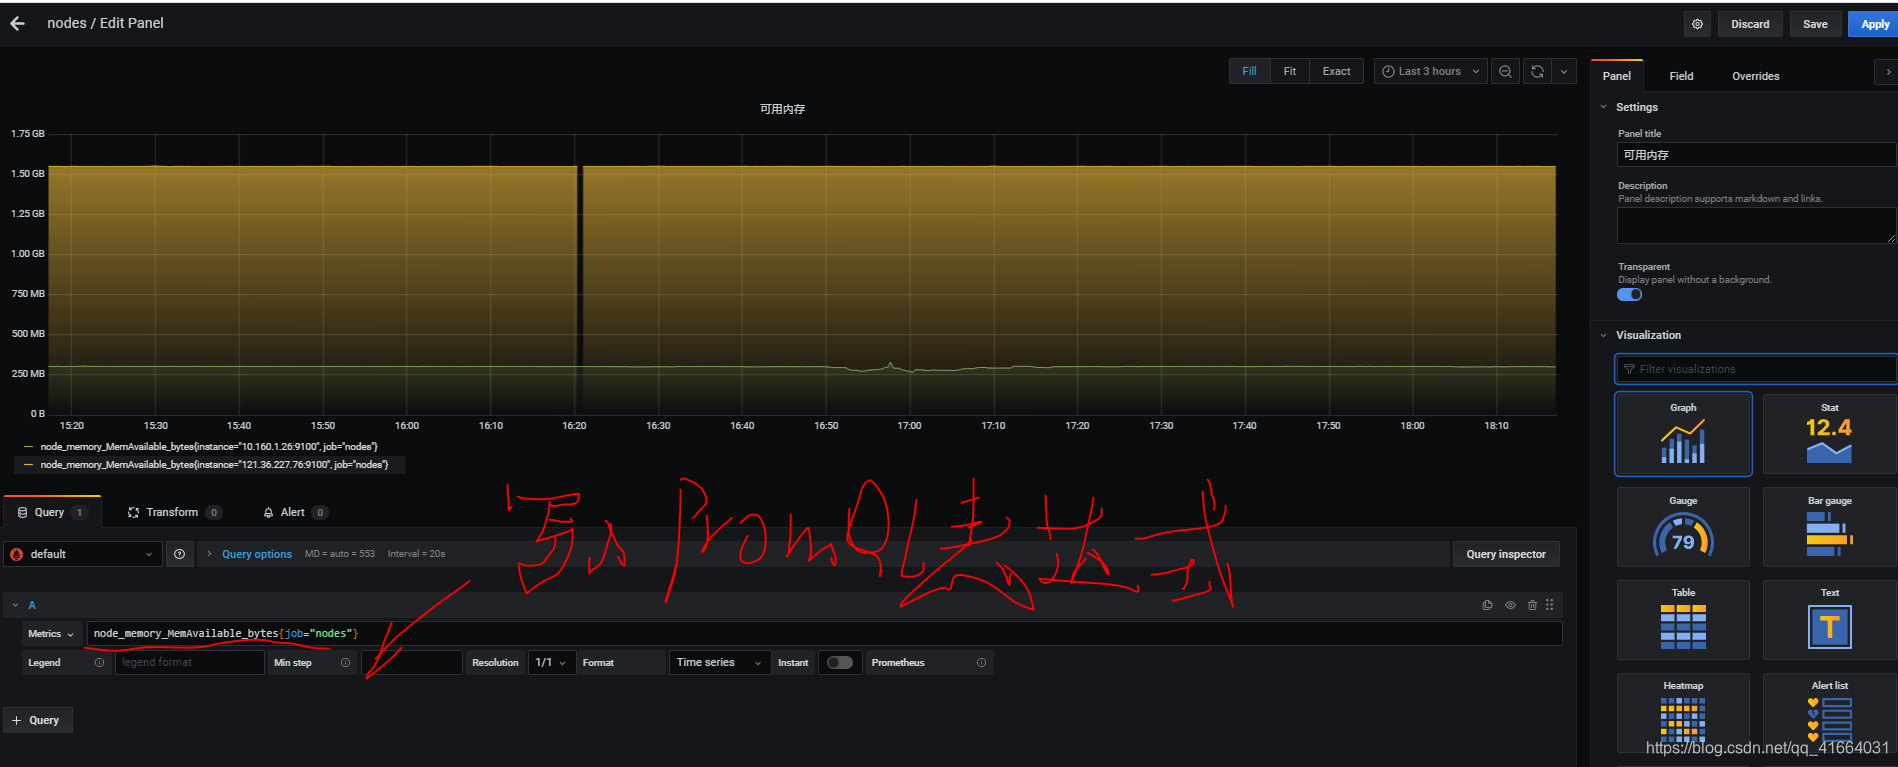
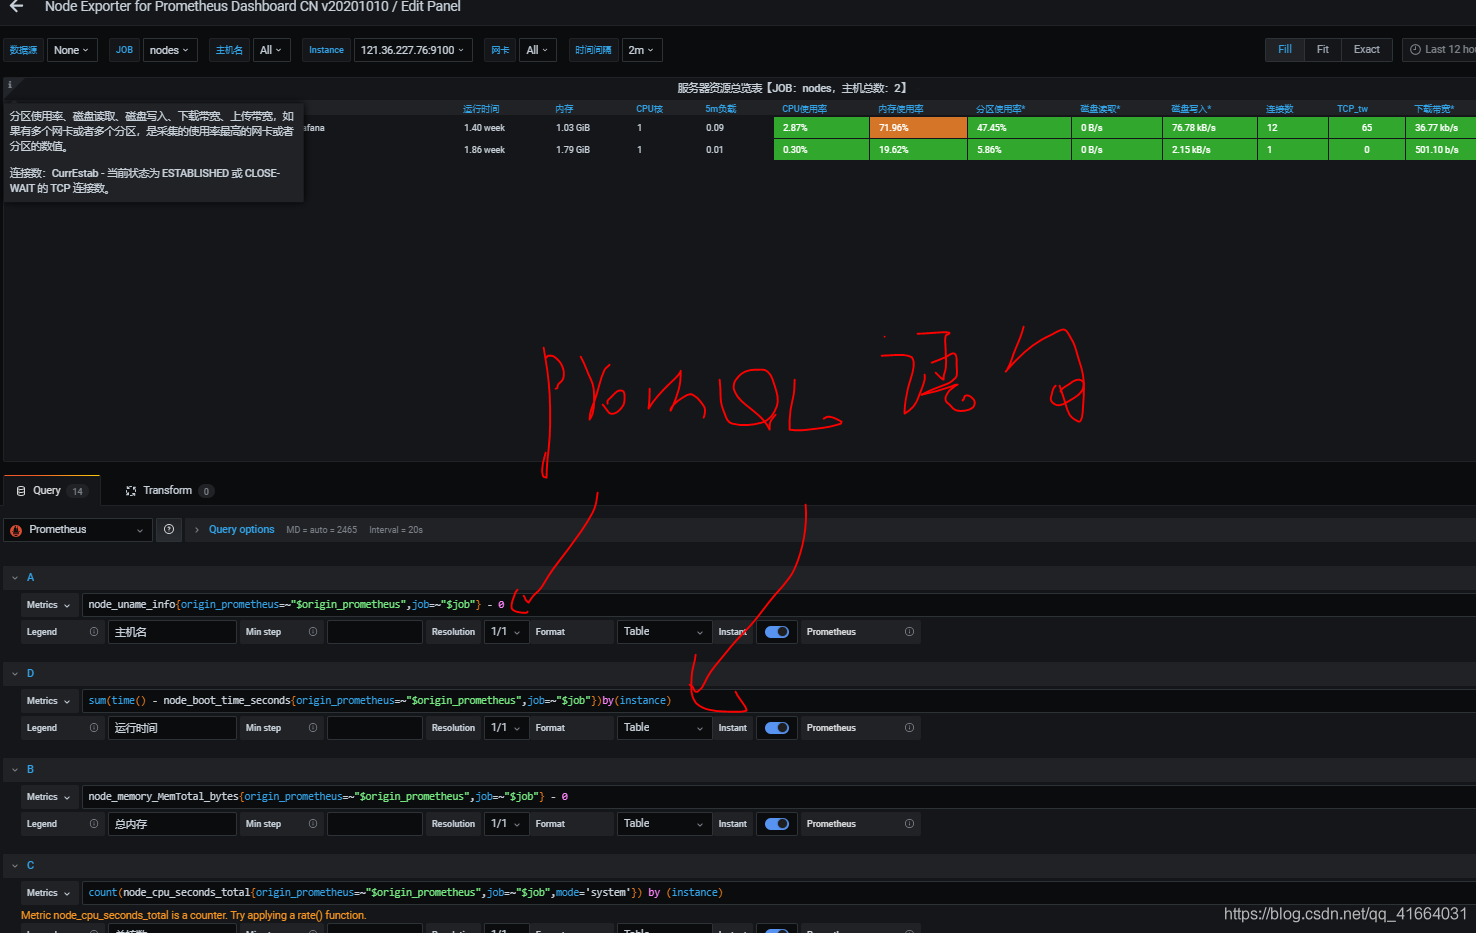
五.PromQL查询语句
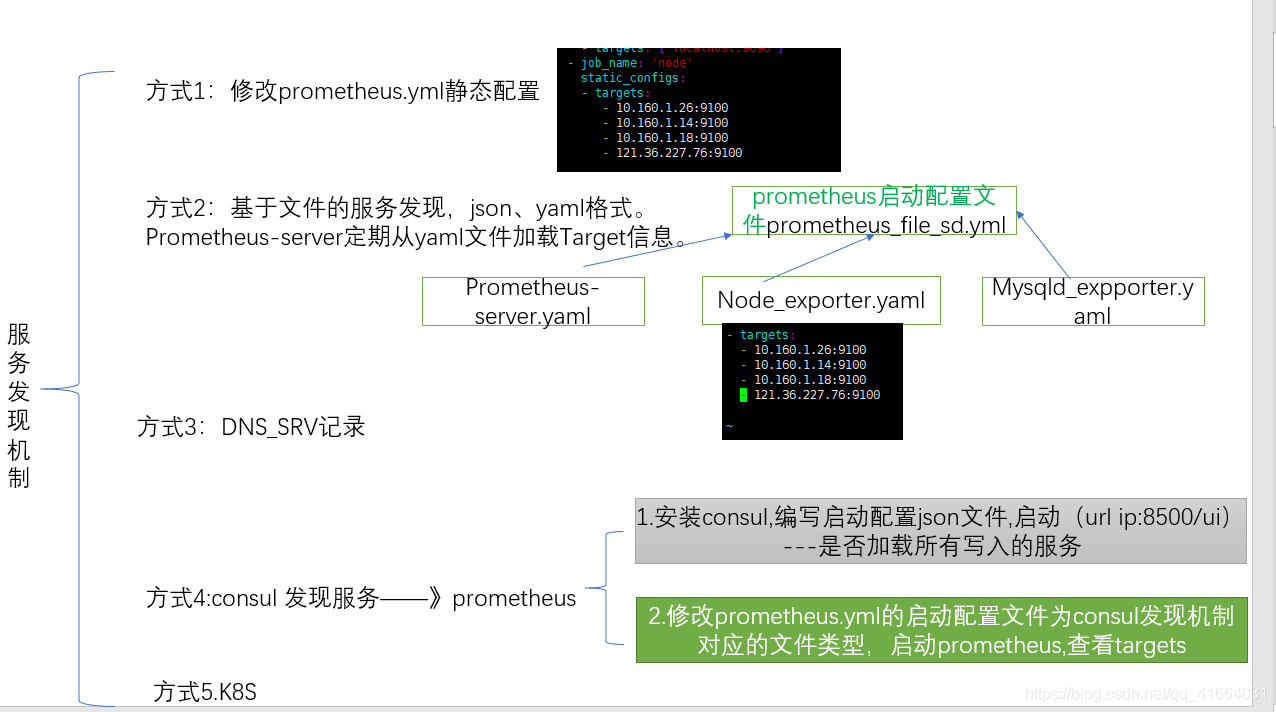
六、服务发现机制、重新打标-配置prometheus的启动配置文件 【服务发现】
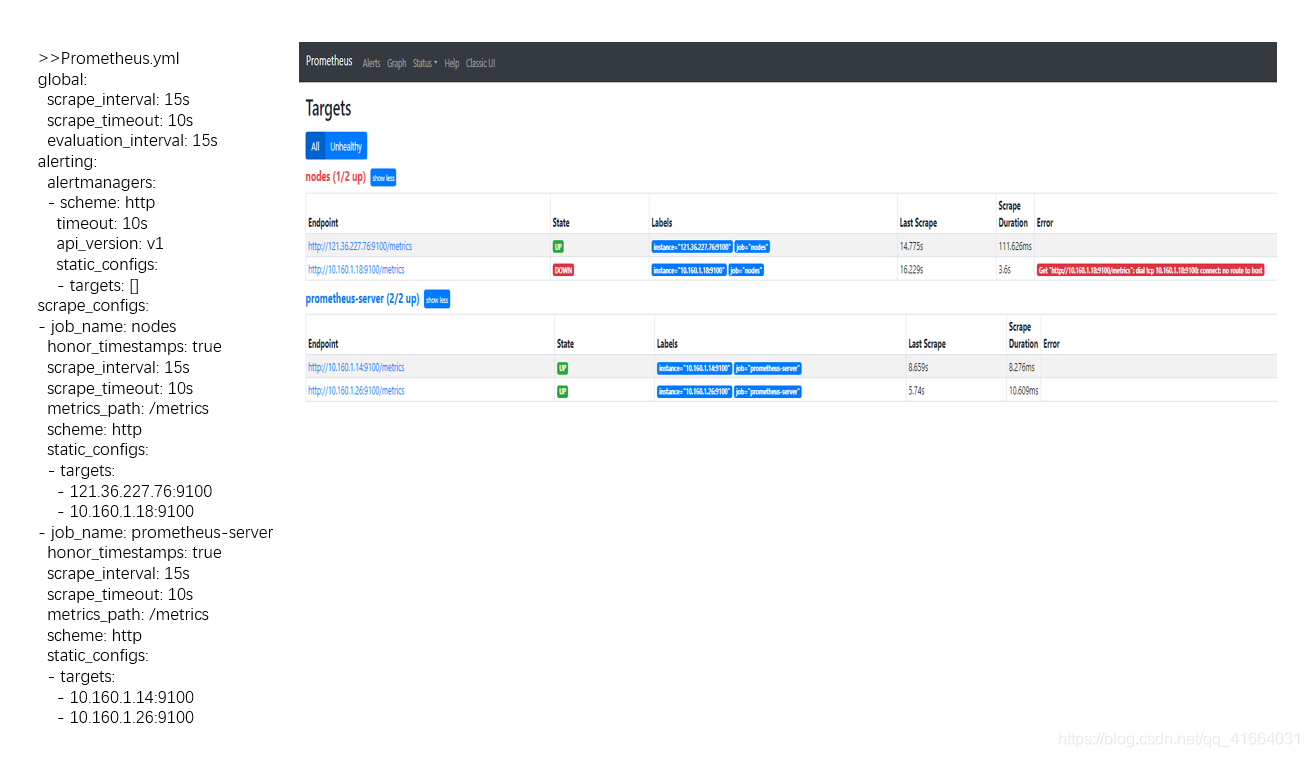
1.静态配置,启动配置文件---->>prometheus.yml
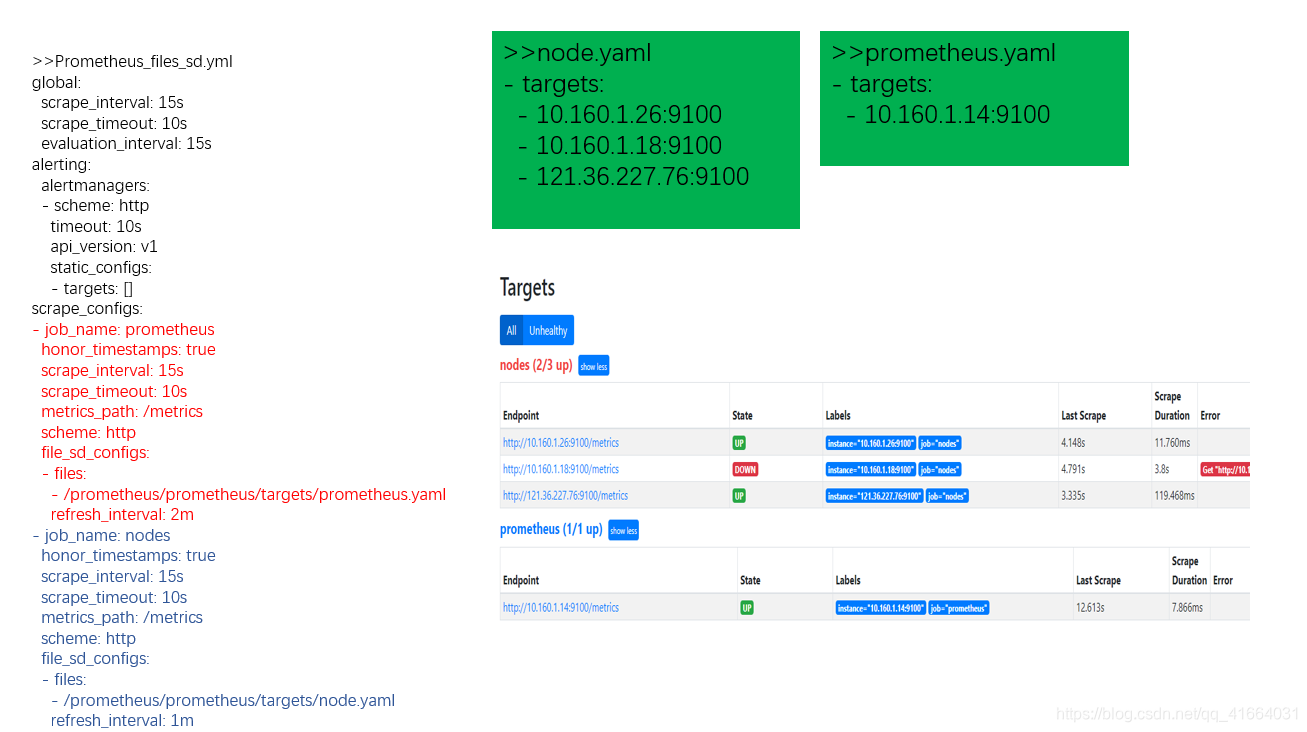
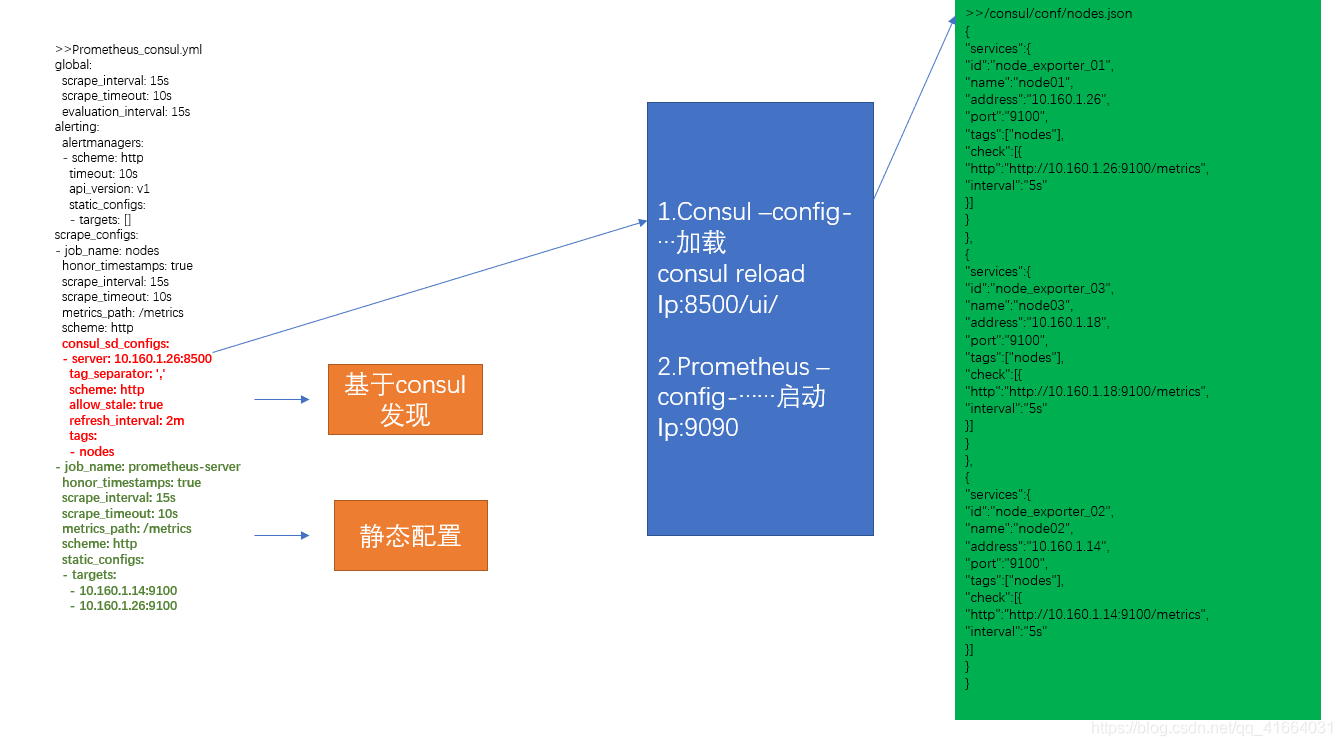
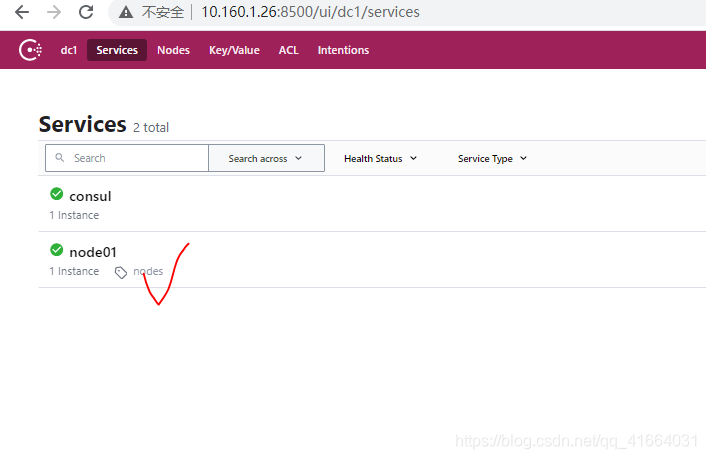
2.基于文件发现服务,prometheus_files_sd.yml 安装目录:mkdir -pv /consul_path 配置文件目录:mkdir -pv /consul/conf/....json 数据目录:mkdir -pv /consul/data/
 (1) .下载地址:https://www.consul.io/downloads/
 (2) .安装unzip consul_1.9.2_linux_amd64.zip -d /consul_path
 (3) .开发者模式
      ./consul agent -dev -ui -data-dir=/consul/data/  -config-dir=/consul/conf -client=0.0.0.0
 (4) .使用
source_labels:使用原始标签 正则表达式: 示例:重新打标label
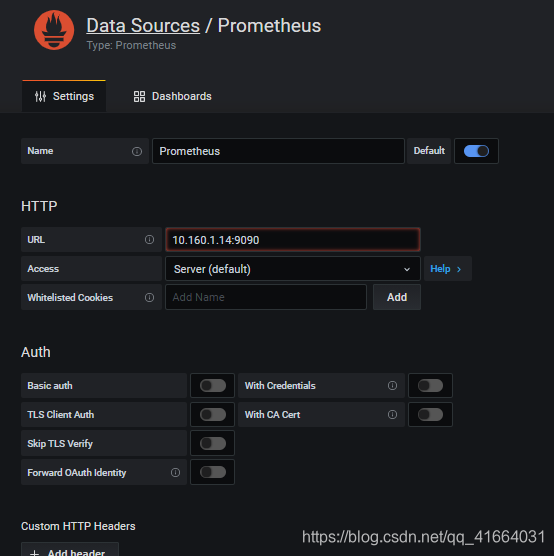
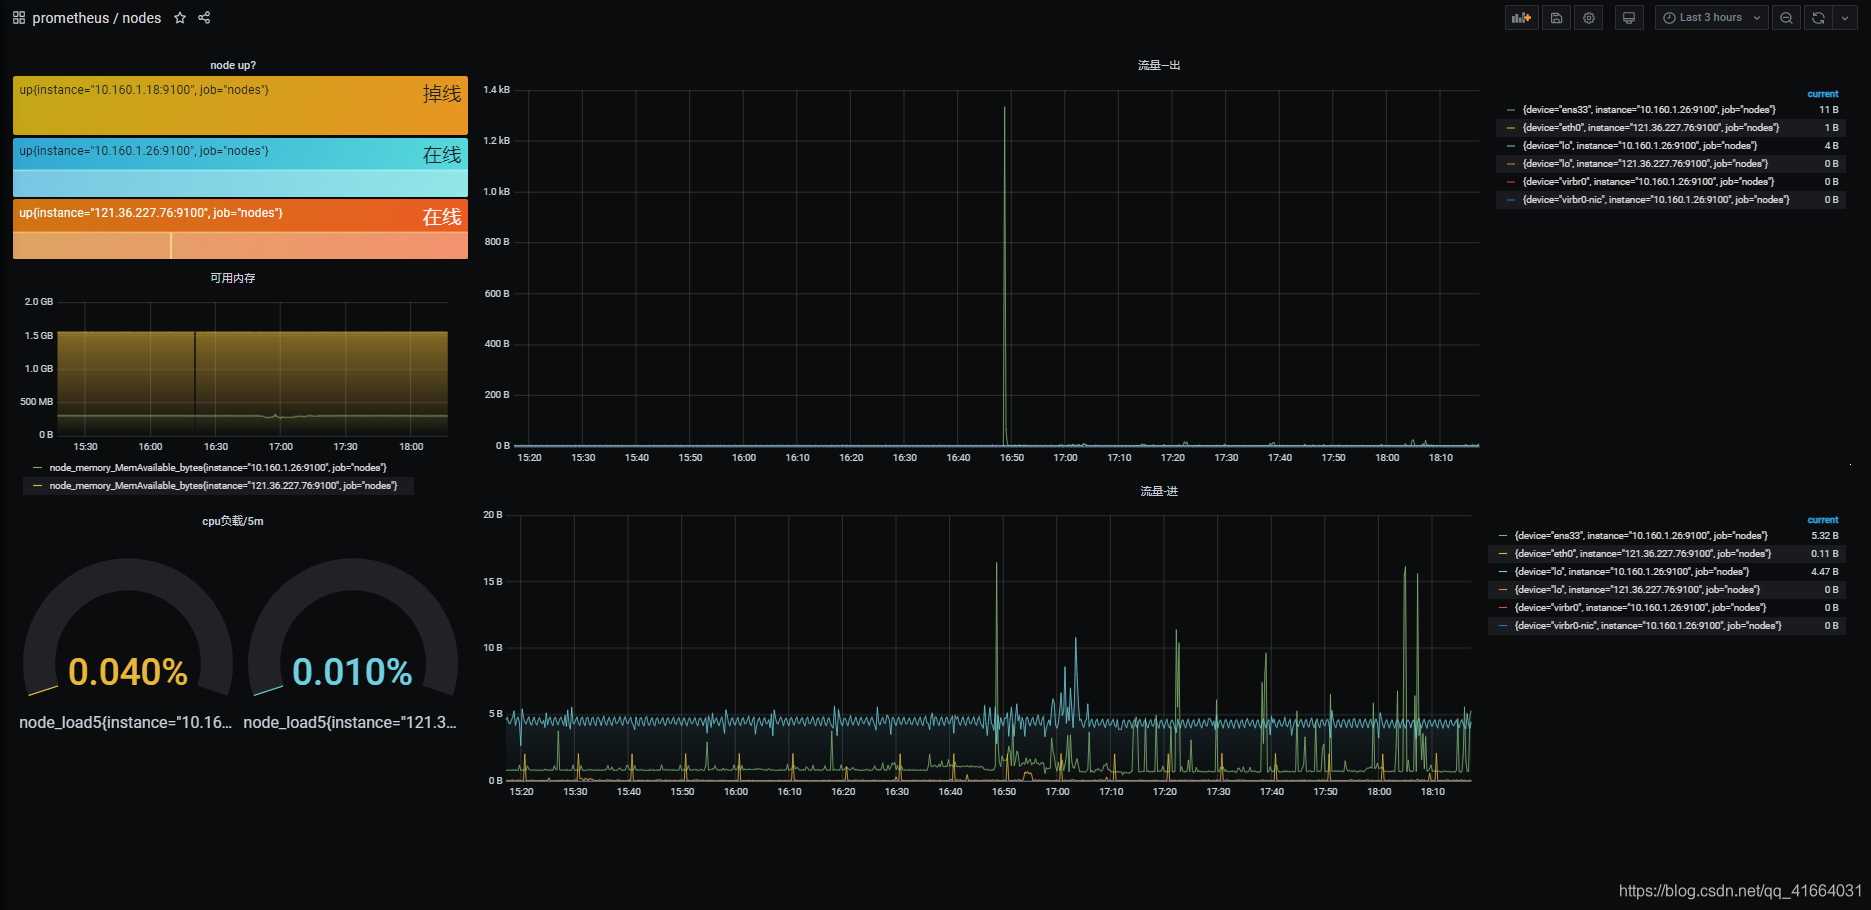
七、Grafana可视化展示-查询持久化 安装Grafana、添加prometheus数据源
所以,关键还是PromQL表达式
【1】部署,加载告警规则 安装: [root@localhost ~]# mkdir /alertmanager #创建目录 [root@localhost ~]# cd /alertmanager/ [root@localhost alertmanager]# rz [root@localhost alertmanager]# tar -zxvf alertmanager-0.21.0.linux-amd64.tar.gz #解压 [root@localhost alertmanager]# ln -s alertmanager-0.21.0.linux-amd64 alertmanager 软连接 [root@localhost alertmanager]# cd alertmanager [root@localhost alertmanager]# ll #添加为服务 [root@localhost alertmanager]# vim /usr/lib/systemd/system/alertmanager.service [Unit] Description=alertmanager [Service] User=root Group=root Type=simple #使用原始的启动脚本 ExecStart=/alertmanager/alertmanager/alertmanager --config.file=/alertmanager/alertmanager/alertmanager.yml [Install] WantedBy=multi-user.target [root@localhost alertmanager]# systemctl daemon-reload [root@localhost alertmanager]# systemctl start alertmanager.service tcp6 0 0 :::9093 :::* LISTEN 51218/alertmanager tcp6 0 0 :::9094 :::* LISTEN 51218/alertmanager ```
2.修改alertmanager.yml根据自己的实际需要,比如告警方式(email、wechat…) 3.修改prometheus_files_sd.yml,
Over!!!
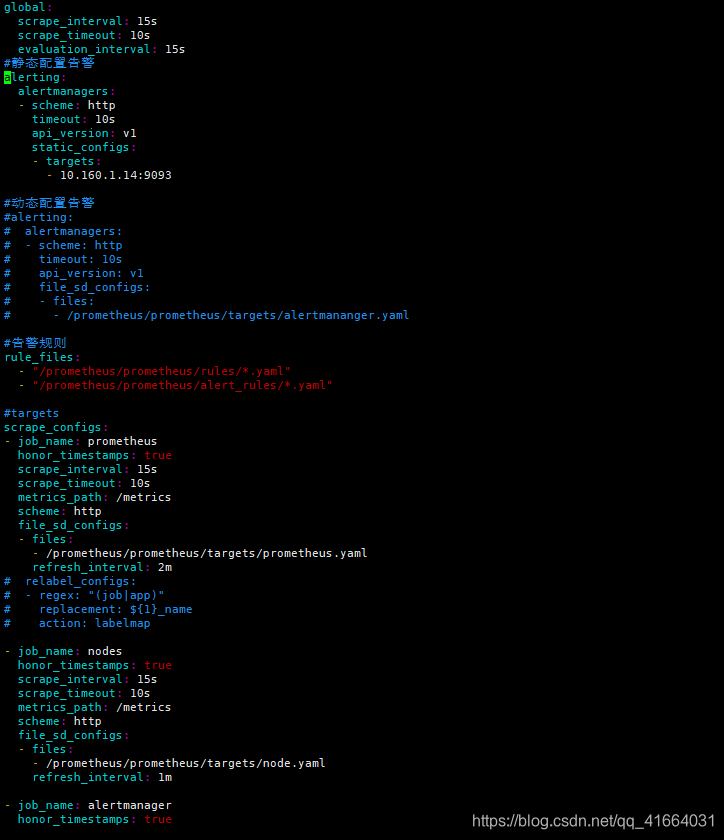
1.prometheus_files_sd.yml
global:
  scrape_interval: 15s
  scrape_timeout: 10s
  evaluation_interval: 15s
#静态配置告警
alerting:
  alertmanagers:
  - scheme: http
    timeout: 10s
    api_version: v1
    static_configs:
    - targets:
      - 10.160.1.14:9093
#动态配置告警
#alerting:
#  alertmanagers:
#  - scheme: http
#    timeout: 10s
#    api_version: v1
#    file_sd_configs:
#    - files:
#      - /prometheus/prometheus/targets/alertmananger.yaml
#告警规则
rule_files:
  - "/prometheus/prometheus/rules/*.yaml"
  - "/prometheus/prometheus/alert_rules/*.yaml"
#targets
scrape_configs:
- job_name: prometheus
  honor_timestamps: true
  scrape_interval: 15s
  scrape_timeout: 10s
  metrics_path: /metrics
  scheme: http
  file_sd_configs:
  - files:
    - /prometheus/prometheus/targets/prometheus.yaml
    refresh_interval: 2m
#  relabel_configs:
#  - regex: "(job|app)"
#    replacement: ${1}_name
#    action: labelmap
- job_name: nodes
  honor_timestamps: true
  scrape_interval: 15s
  scrape_timeout: 10s
  metrics_path: /metrics
  scheme: http
  file_sd_configs:
  - files:
    - /prometheus/prometheus/targets/node.yaml
    refresh_interval: 1m
- job_name: alertmanager
  honor_timestamps: true
  scrape_interval: 15s
  scrape_timeout: 10s
  metrics_path: /metrics
  scheme: http
  file_sd_configs:
  - files:
    - /prometheus/prometheus/targets/alertmanager.yaml
    refresh_interval: 1m
2.告警规则/rules/up.yaml
groups:
- name: 'target在线状态'
  rules:
  - alert: 'target在线状态'
    expr: up{job="nodes"}  == 0
    for: 20s
    labels:
      severity: 'node_exporter'
    annotations:
      title: 'node_expoerer告警'
      summary: 'node_exporter 未在运行'

- name: 'prometheus-server状态'
  rules:
  - alert: 'server在线状态'
    expr: up{job="prometheus"}  == 0
    for: 20s
    labels:
      severity: 'prometheus-server'
    annotations:
      title: 'prometheus-server告警'
      summary: 'prometheus-server 未在运行'
3./targets/node.ymal - targets: - 10.160.1.26:9100 - 10.160.1.18:9100 - 121.36.227.76:9100 4./targets/prometheus.ymal - targets: - 10.160.1.14:9090 - 10.160.1.26:9090 5.假如使用consul,/consul/conf/**.json
{
"services":
[
{
"id": "node_exporter_01",
"name": "node01",
"address": "121.36.227.76",
"port": 9100,
"tags": ["nodes"],
"check":
[{
"http": "http://112.36.227.76:9100/metrics",
"interval": "5s"
}]
},
{
"id": "node_exporter_02",
"name": "node02",
"address": "10.160.1.18",
"port": 9100,
"tags": ["nodes"],
"check":
[{
"http": "http://10.160.1.18:9100/metrics",
"interval": "5s"
}]
}
]
}
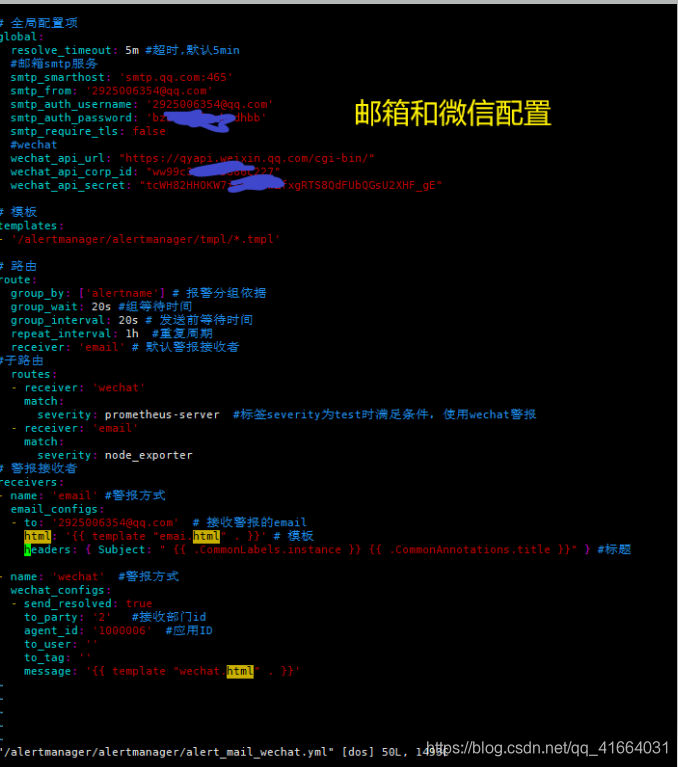
6.alertmanager_email_wechat.yml
# 全局配置项
global:
  resolve_timeout: 5m #超时,默认5min
  #邮箱smtp服务
  smtp_smarthost: 'smtp.qq.com:465'
  smtp_from: '2925006354@qq.com'
  smtp_auth_username: '2925006354@qq.com'
  smtp_auth_password: '***'
  smtp_require_tls: false
  #wechat
  wechat_api_url: "https://qyapi.weixin.qq.com/cgi-bin/"
  wechat_api_corp_id: " *"
  wechat_api_secret: "***"
# 模板
templates:
- '/alertmanager/alertmanager/tmpl/*.tmpl'
# 路由
route:
  group_by: ['alertname'] # 报警分组依据
  group_wait: 20s #组等待时间
  group_interval: 20s # 发送前等待时间
  repeat_interval: 1h  #重复周期
  receiver: 'email' # 默认警报接收者
#子路由
  routes:
  - receiver: 'wechat'
    match:
      severity: prometheus-server  #标签severity为test时满足条件,使用wechat警报
  - receiver: 'email'
    match:
      severity: node_exporter
# 警报接收者
receivers:
- name: 'email' #警报方式
  email_configs:
  - to: '2925006354@qq.com'  # 接收警报的email
    html: '{{ template "emai.html" . }}' # 模板
    headers: { Subject: " {{ .CommonLabels.instance }} {{ .CommonAnnotations.title }}" } #标题

- name: 'wechat'  #警报方式
  wechat_configs:
  - send_resolved: true
    to_party: '2'   #接收部门id
    agent_id: '1000006'  #应用ID
    to_user: ''
    to_tag: ''
    message: '{{ template "wechat.html" . }}'
7.消息模板
email.tpml
{{ define "emai.html" }}
{{- if gt (len .Alerts.Firing) 0 -}}{{ range .Alerts }}
@告警信息:
<pre>
告警级别: {{ .Labels.severity }} 级<br>
告警类型: {{ .Labels.alertname }}<br>
故障实例: {{ .Labels.instance }}<br>
告警主题: {{ .Annotations.summary }}<br>
⏱ : {{ (.StartsAt.Add 28800e9).Format "2006/01/02 15:04:05" }} <br>
</pre>
{{ end }}{{ end -}}
{{- if gt (len .Alerts.Resolved) 0 -}}{{ range .Alerts }}
@告警已恢复
<pre>
告警级别: {{ .Labels.severity }} 级<br>
告警类型: {{ .Labels.alertname }}<br>
恢复实例: {{ .Labels.instance }}<br>
恢复主题: {{ .Annotations.summary }}<br>
⏱ : {{ (.StartsAt.Add 28800e9).Format "2006/01/02 15:04:05" }}<br>
恢复时间:{{ .EndsAt.Format "2006-01-02 15:04:05" }} <br>
</pre>
{{ end }}{{ end -}}
{{- end }}
wechat.tpml
{{ define "wechat.html" }}
{{- if gt (len .Alerts.Firing) 0 -}}{{ range .Alerts }}
@告警信息:
告警级别: {{ .Labels.severity }} 级
告警类型: {{ .Labels.alertname }}
故障实例: {{ .Labels.instance }}
告警主题: {{ .Annotations.summary }}
⏱ : {{ (.StartsAt.Add 28800e9).Format "2006/01/02 15:04:05" }}
{{ end }}{{ end -}}
{{- if gt (len .Alerts.Resolved) 0 -}}{{ range .Alerts }}
@告警已恢复
告警级别: {{ .Labels.severity }} 级
告警类型: {{ .Labels.alertname }}
恢复实例: {{ .Labels.instance }}
恢复主题: {{ .Annotations.summary }}
⏱ : {{ (.StartsAt.Add 28800e9).Format "2006/01/02 15:04:05" }}
恢复时间:{{ .EndsAt.Format "2006-01-02 15:04:05" }}
{{ end }}{{ end -}}
{{- end }}


https://blog.csdn.net/qq_41664031/article/details/113176639?utm_medium=distribute.pc_category.none-task-blog-hot-8.nonecase&depth_1-utm_source=distribute.pc_category.none-task-blog-hot-8.nonecase&request_id=
(责任编辑:IT) |


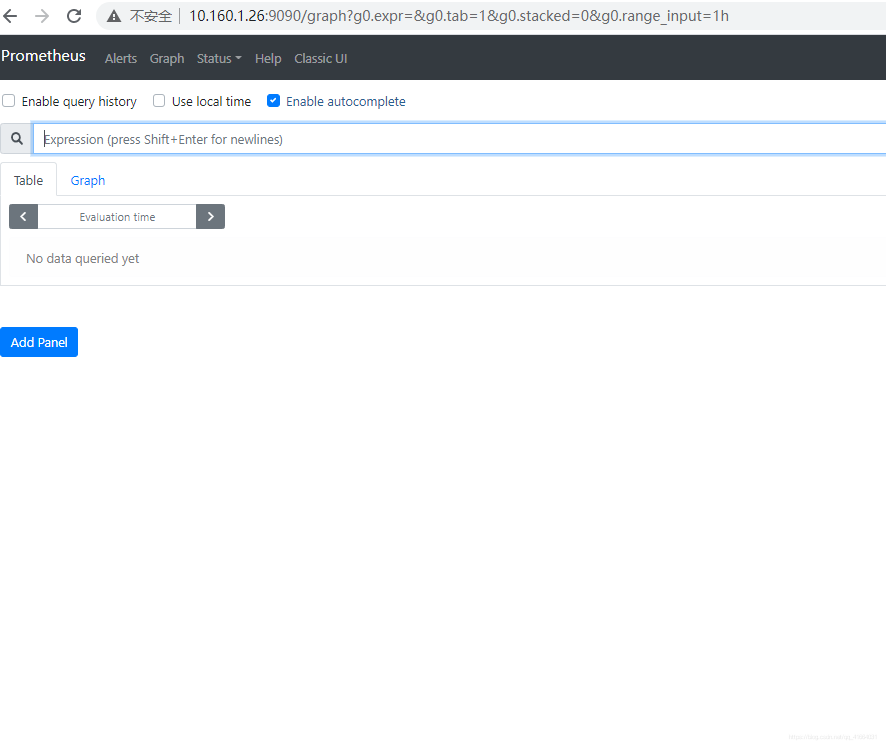
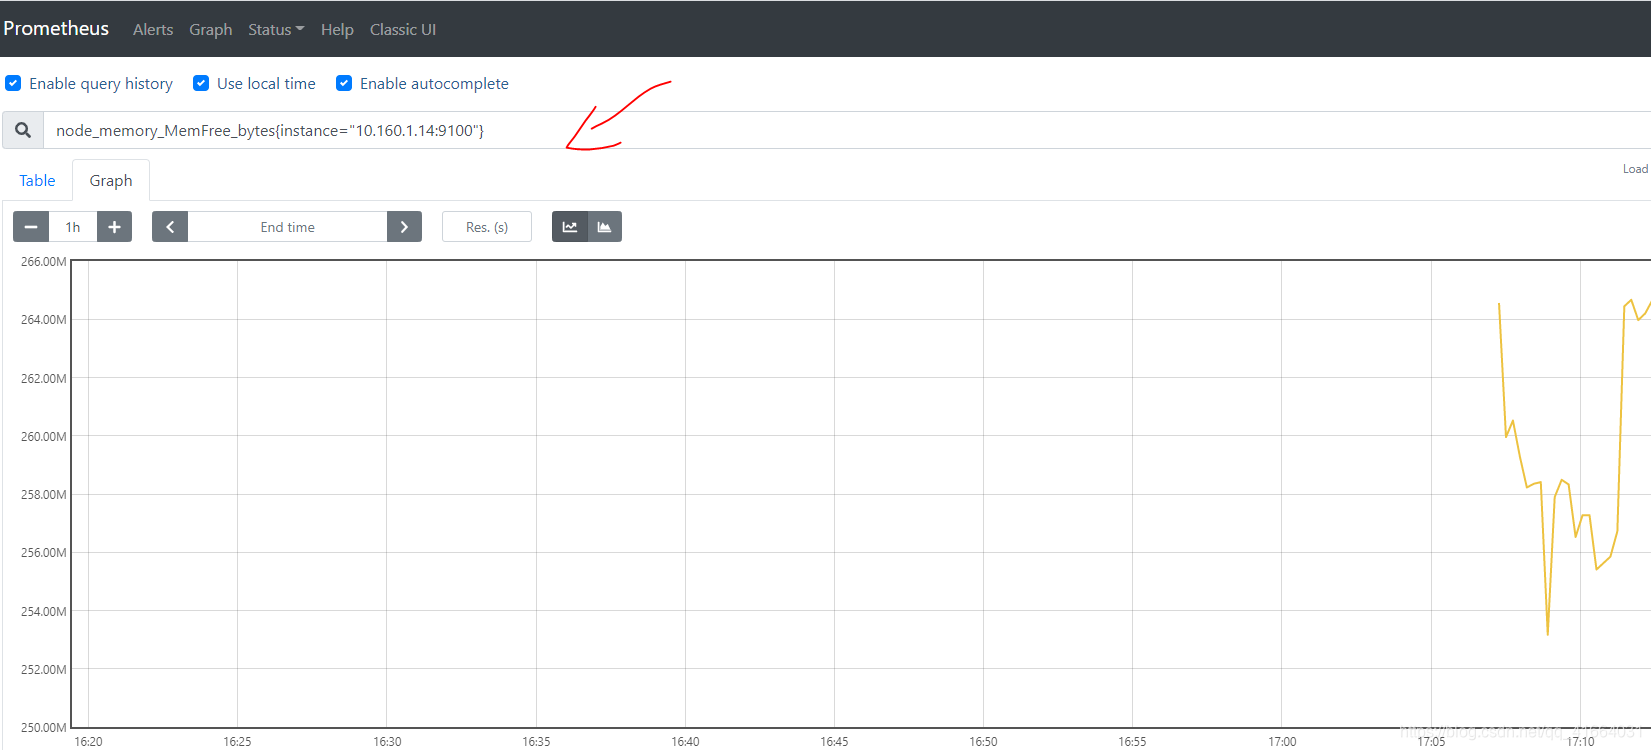
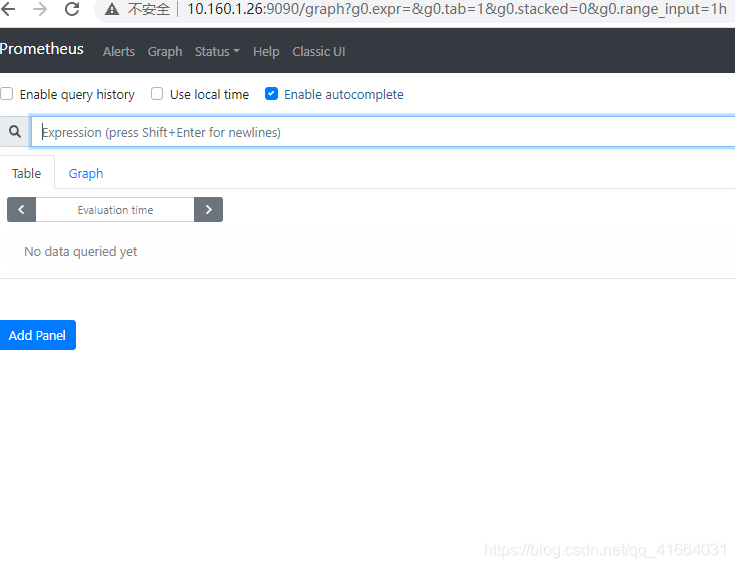 Prometheus web界面的简单使用,核心为查询公式PromQL
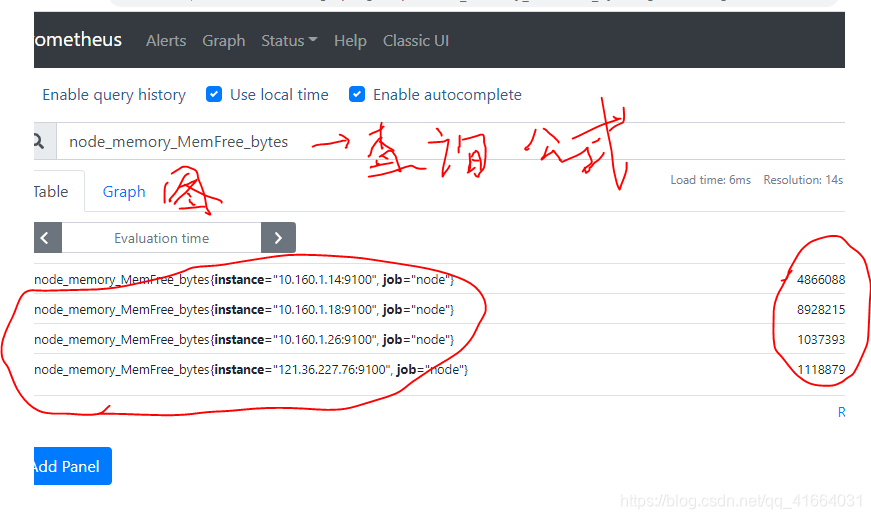

 5.基于Kubernetes API动态发现服务及指标抓取的生命周期
 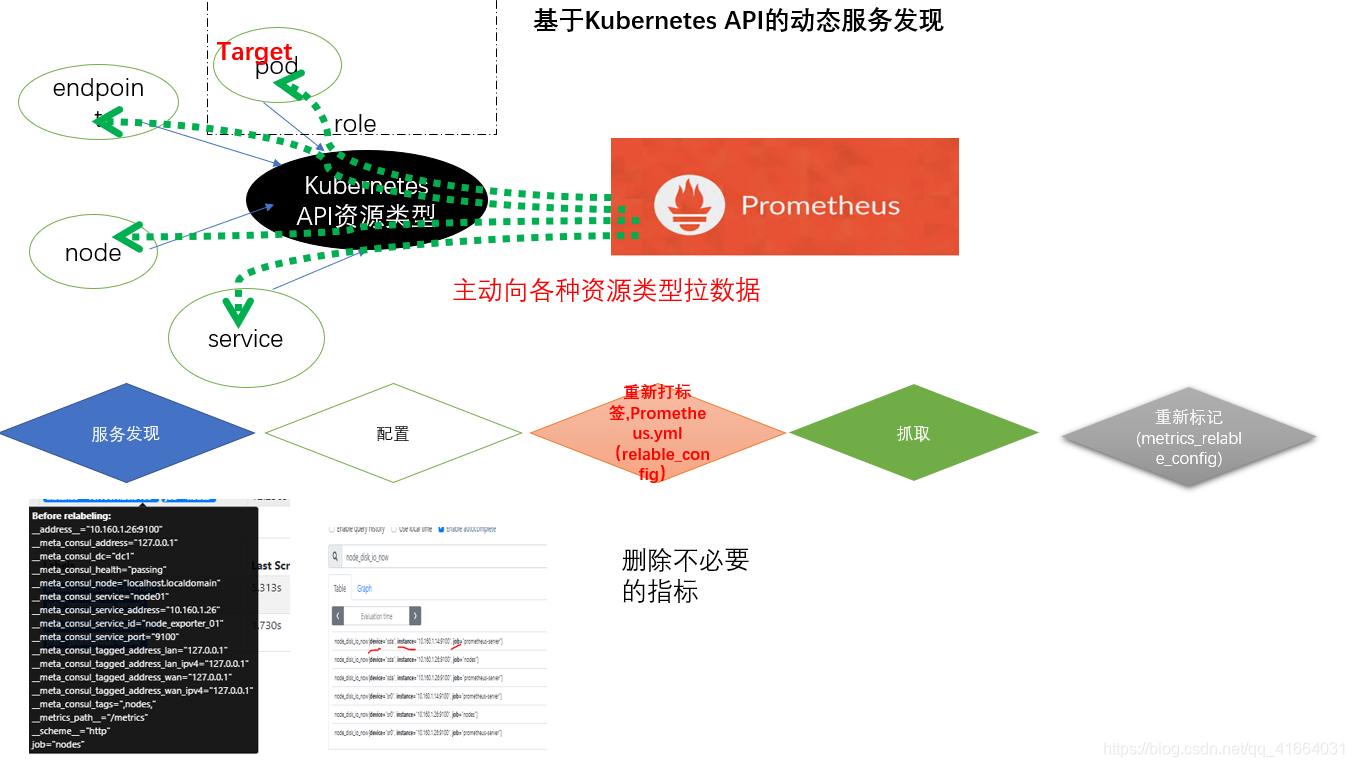 【2】重新打标,相当于zabbix更改监控项,修改prometheus的配置 对于发现的每个目标,prometheus会默认执行操作。 relabel_config重新打标:
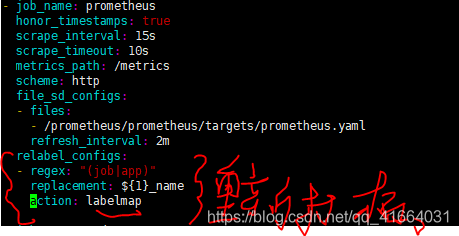 重新打标之前:
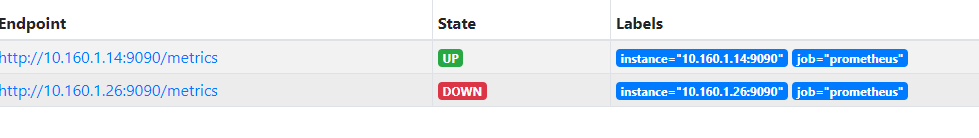 重新打标以后:
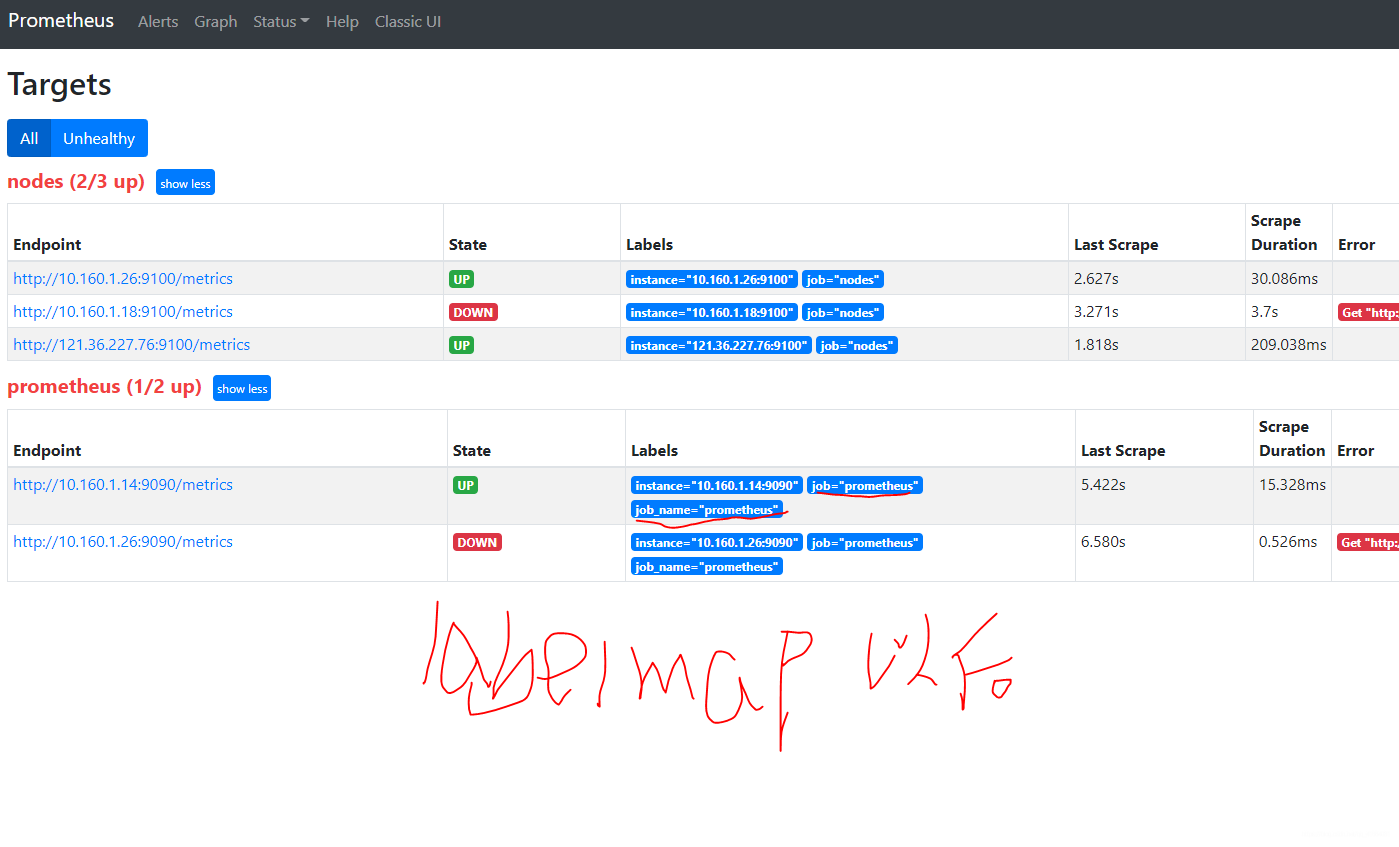
 如果自己太烧脑,也可以使用Grafana提供的模板。复制ID 导入即可,模板是在线的。
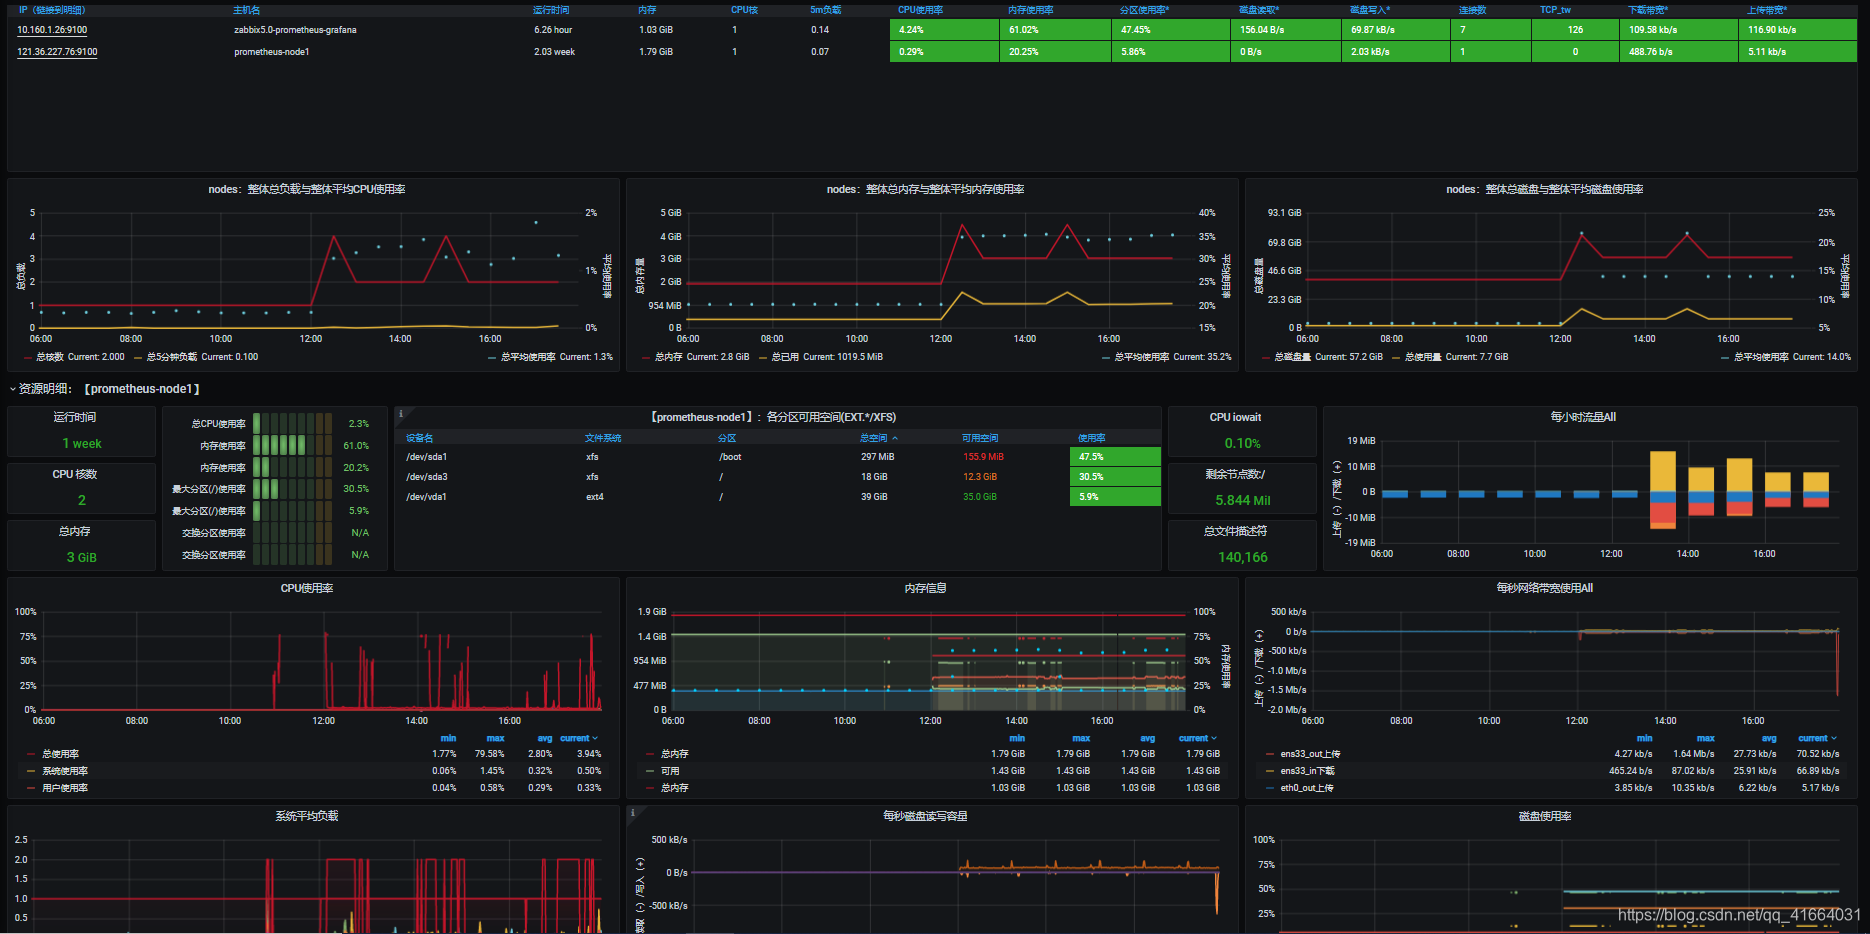
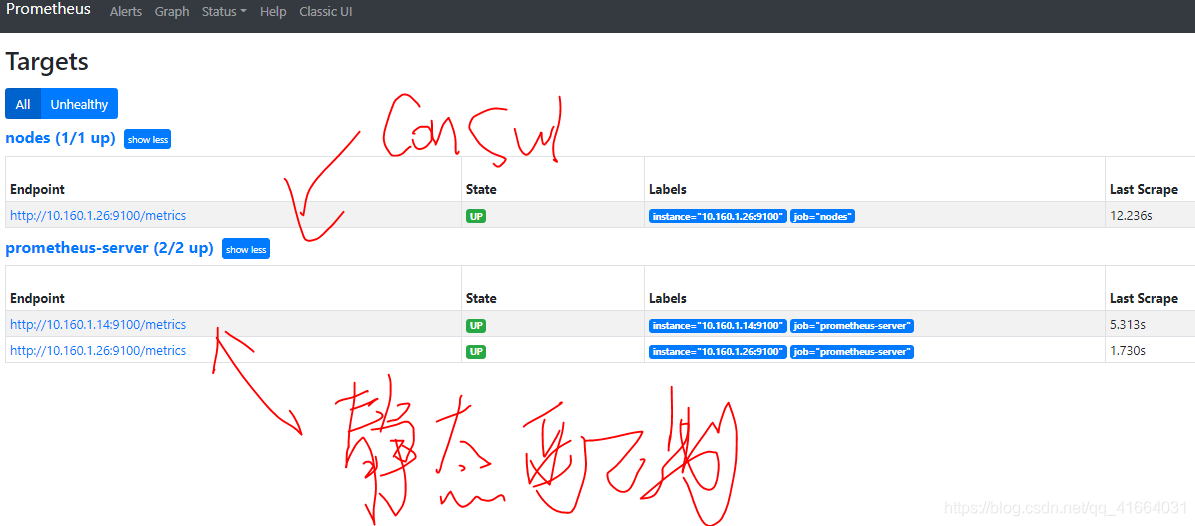
 基于文件发现/…yaml
 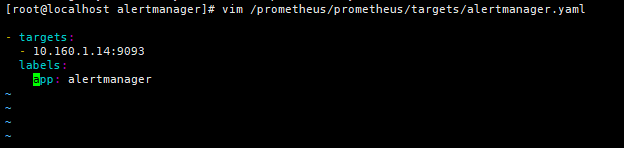 告警规则/rules/up.yaml,被用于prometheus的配置文件中
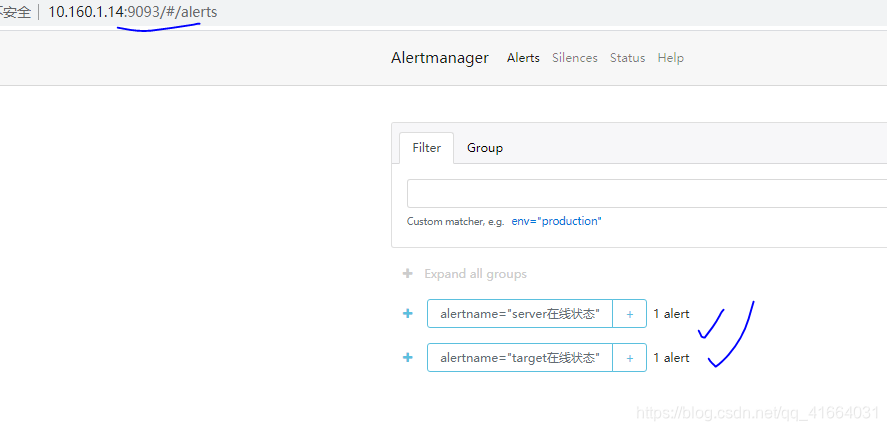
 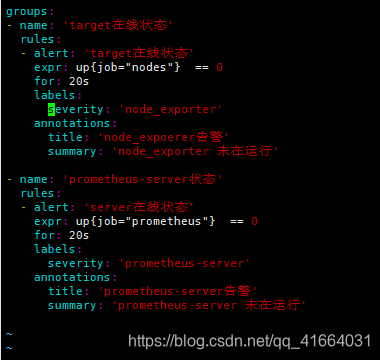 启动prometheus,alertmanager 查看web: ip:9090 ip:9093 关闭一个node_exporter和一个prometheus-server,看web界面的变化和告警消息的接收情况 1.实验前
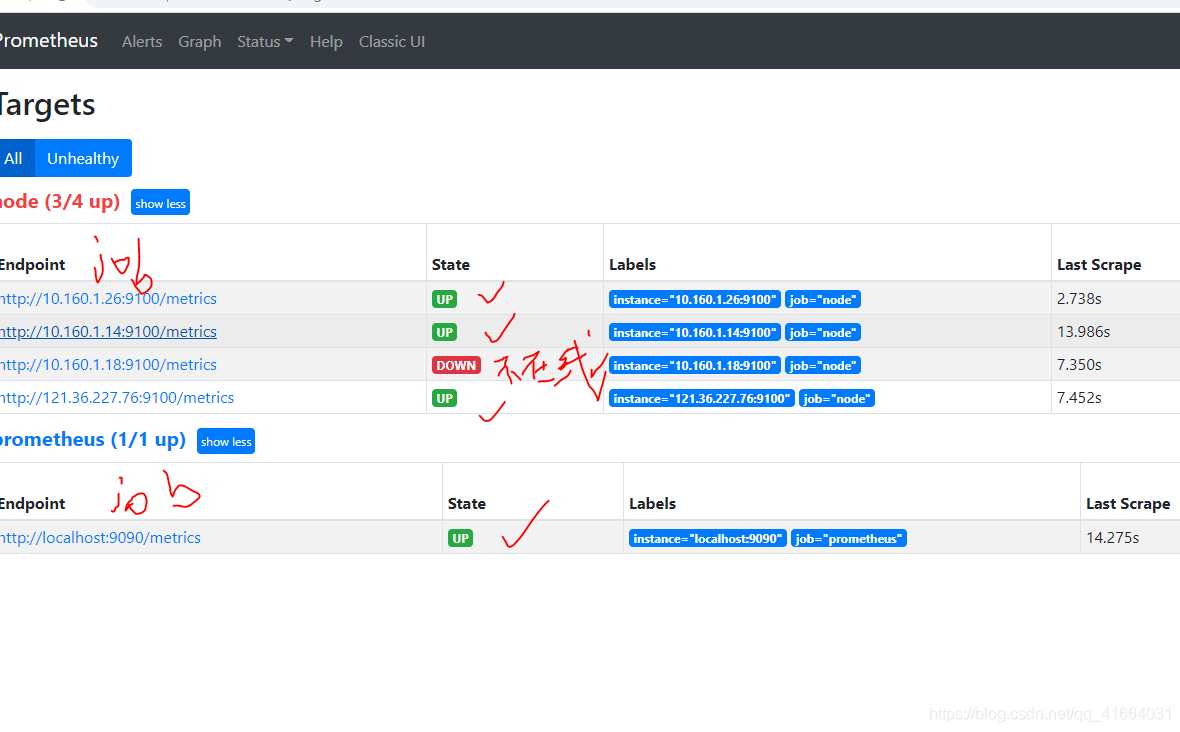
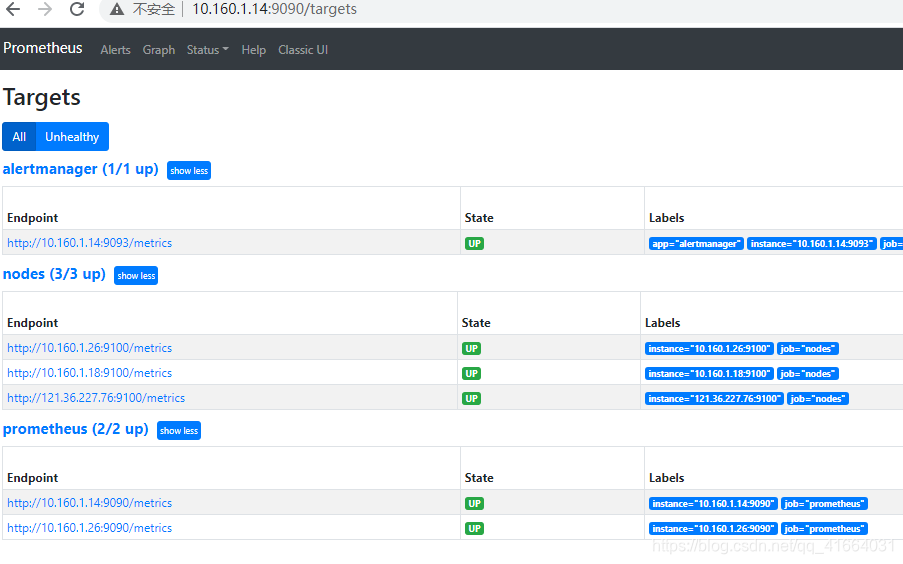 2.关闭target
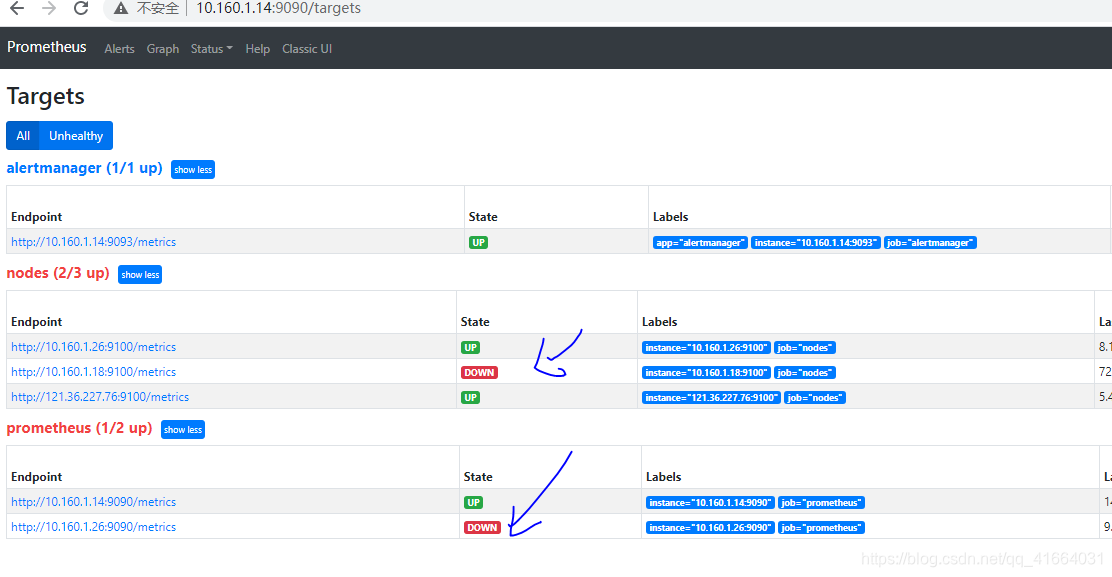 3.看变化
3.看变化
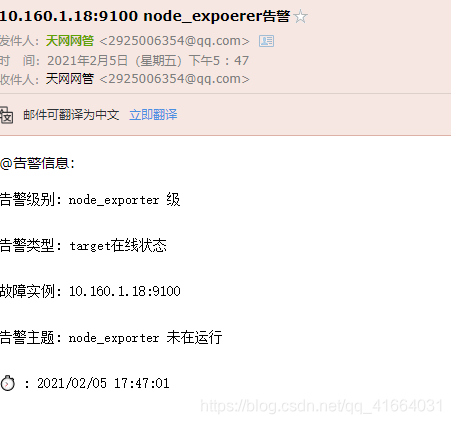
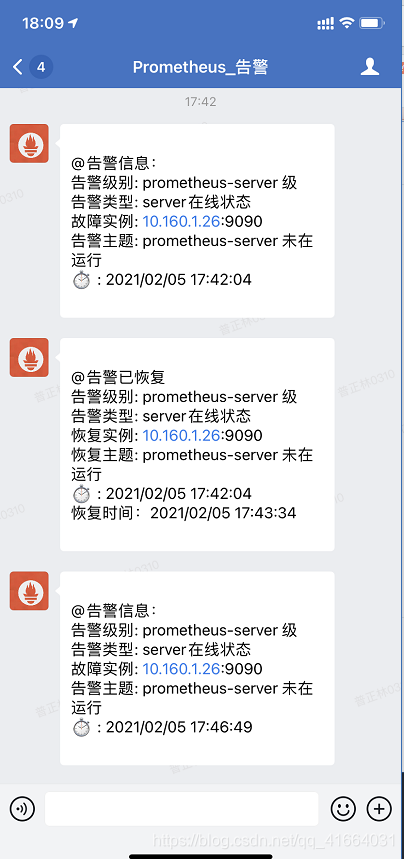
 4.收到告警信息